

190
Y. Olsen
20
~
..c
.~ 10
~
..c
'"
...
./:
5
.... .,
~ 2
~
~
~
1
-= =
. .
-< 0.5
= Q
0.2
50
;?
::: 30
S .,
... 20
.... .,
~
~
~IO
~
-= =
. .
-< 5
= Q
11 •
I
I
A
•
•
Ii
I •
B
.,'1
I'
II I
r;
"
1
10
100
1,000
10,000
Individual weight (g fresh weight)
DHA-seawater phase
•
EPA-seawater phase
()
EPA-fresh water phase
()
DHA-fresh water phase
•
%DHA-seawater phase
•
%EPA-seawater phase
n
%EPA-fresh water phase
o/oDHA-fresh water phase
•
DHA in feed
4
4 EPA in feed
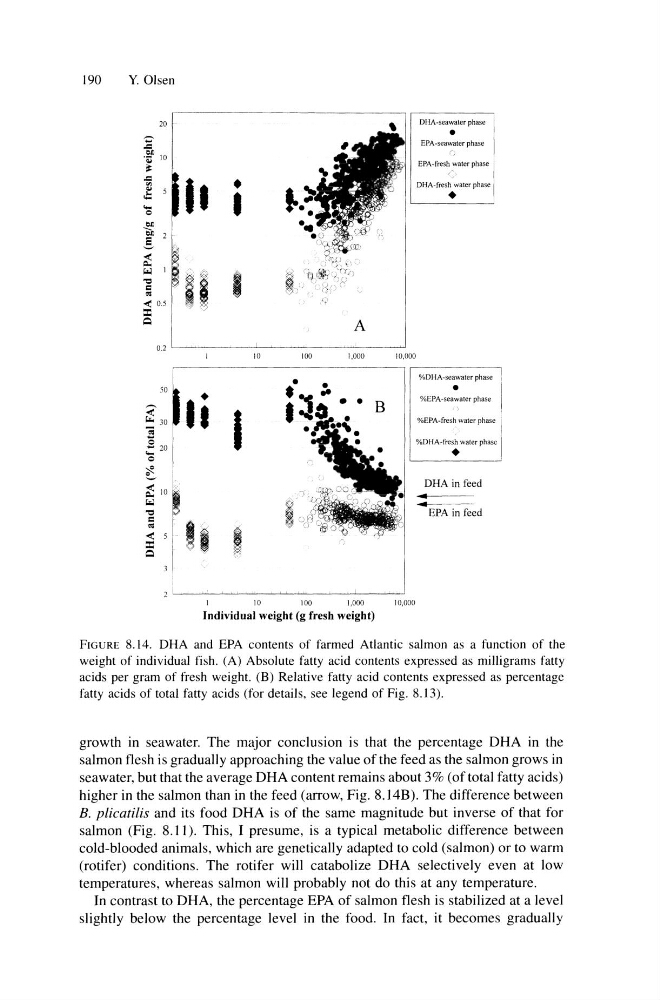
FIGURE 8.14, DHA and EPA contents of farmed Atlantic salmon as a function of the
weight of individual fish. (A) Absolute fatty acid contents expressed as milligrams fatty
acids per gram of fresh weight. (B) Relative fatty acid contents expressed as percentage
fatty acids of total fatty acids (for details, see legend of Fig. 8,13),
growth in seawater. The major conclusion is that the percentage DHA in the
salmon flesh is gradually approaching the value of the feed as the salmon grows in
seawater, but that the average DHA content remains about 3% (of total fatty acids)
higher in the salmon than in the feed (arrow, Fig. 8.l4B). The difference between
B. plicatilis and its food DHA is of the same magnitude but inverse of that for
salmon (Fig. 8.11). This, I presume, is a typical metabolic difference between
cold-blooded animals, which are genetically adapted to cold (salmon) or to warm
(rotifer) conditions. The rotifer will catabolize DHA selectively even at low
temperatures, whereas salmon will probably not do this at any temperature.
In contrast to DHA, the percentage EPA of salmon flesh is stabilized at a level
slightly below the percentage level in the food. In fact, it becomes gradually
Y. Olsen
20
~
..c
.~ 10
~
..c
'"
...
./:
5
.... .,
~ 2
~
~
~
1
-= =
. .
-< 0.5
= Q
0.2
50
;?
::: 30
S .,
... 20
.... .,
~
~
~IO
~
-= =
. .
-< 5
= Q
11 •
I
I
A
•
•
Ii
I •
B
.,'1
I'
II I
r;
"
1
10
100
1,000
10,000
Individual weight (g fresh weight)
DHA-seawater phase
•
EPA-seawater phase
()
EPA-fresh water phase
()
DHA-fresh water phase
•
%DHA-seawater phase
•
%EPA-seawater phase
n
%EPA-fresh water phase
o/oDHA-fresh water phase
•
DHA in feed
4
4 EPA in feed
FIGURE 8.14, DHA and EPA contents of farmed Atlantic salmon as a function of the
weight of individual fish. (A) Absolute fatty acid contents expressed as milligrams fatty
acids per gram of fresh weight. (B) Relative fatty acid contents expressed as percentage
fatty acids of total fatty acids (for details, see legend of Fig. 8,13),
growth in seawater. The major conclusion is that the percentage DHA in the
salmon flesh is gradually approaching the value of the feed as the salmon grows in
seawater, but that the average DHA content remains about 3% (of total fatty acids)
higher in the salmon than in the feed (arrow, Fig. 8.l4B). The difference between
B. plicatilis and its food DHA is of the same magnitude but inverse of that for
salmon (Fig. 8.11). This, I presume, is a typical metabolic difference between
cold-blooded animals, which are genetically adapted to cold (salmon) or to warm
(rotifer) conditions. The rotifer will catabolize DHA selectively even at low
temperatures, whereas salmon will probably not do this at any temperature.
In contrast to DHA, the percentage EPA of salmon flesh is stabilized at a level
slightly below the percentage level in the food. In fact, it becomes gradually