

8. Lipids and Essential Fatty Acids in Aquatic Food Webs
183
7 ,--------------------------n
A
6
•
•
•
•
•
o
0.01
0.1
1
10
100
1,000
Time after change in feed (h)
EPA increase with Tel
DHA increase with Iso
3.5
2.5
~
~ 2
:!
~ I.S
'0
~ 1
;;
~ 0.5
0.
o
EPAwithTet
f '
-
Tetto Iso
~
Tel to Yst
+B
2
Time after cbange in feed (b)
DHA with Iso
C
...
Iso to Tet
~
.
Isoto Yst
.
c,
?'
v
K
' 0
') C,
c
,)
o
Time after change in feed (b)
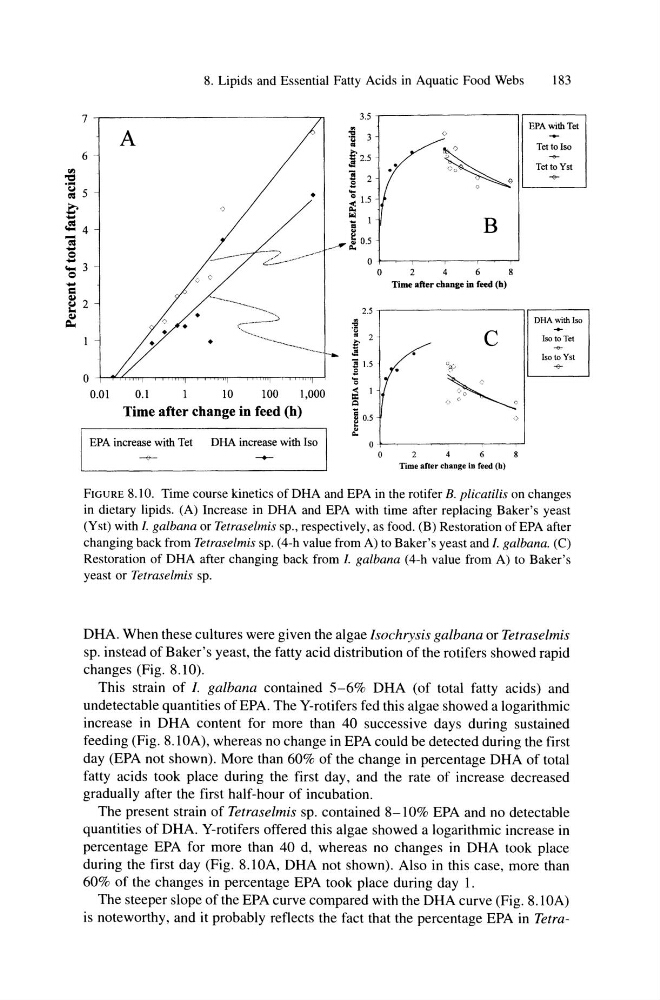
FIGURE 8.10. Time course kinetics of DHA and EPA in the rotifer B. plicatilis on changes
in dietary lipids. (A) Increase in DHA and EPA with time after replacing Baker's yeast
(Yst) with I. galbana or Tetraselmis sp., respectively, as food. (B) Restoration of EPA after
changing back from Tetraselmis sp. (4-h value from A) to Baker's yeast and I. galbana. (C)
Restoration of DHA after changing back from I. galbana (4-h value from A) to Baker's
yeast or Tetraselmis sp.
DHA. When these cultures were given the algae Isochrysis galbana or Tetraselmis
sp. instead of Baker's yeast, the fatty acid distribution of the rotifers showed rapid
changes (Fig. 8.10).
This strain of I. galbana contained 5-6% DHA (of total fatty acids) and
undetectable quantities of EPA. The Y-rotifers fed this algae showed a logarithmic
increase in DHA content for more than 40 successive days during sustained
feeding (Fig. 8.1 OA), whereas no change in EPA could be detected during the first
day (EPA not shown). More than 60% of the change in percentage DHA of total
fatty acids took place during the first day, and the rate of increase decreased
gradually after the first half-hour of incubation.
The present strain of Tetraselmis sp. contained 8-10% EPA and no detectable
quantities of DHA. Y-rotifers offered this algae showed a logarithmic increase in
percentage EPA for more than 40 d, whereas no changes in DHA took place
during the first day (Fig. 8.lOA, DHA not shown). Also in this case, more than
60% of the changes in percentage EPA took place during day 1.
The steeper slope of the EPA curve compared with the DHA curve (Fig. 8.1 OA)
is noteworthy, and it probably reflects the fact that the percentage EPA in Tetra-
183
7 ,--------------------------n
A
6
•
•
•
•
•
o
0.01
0.1
1
10
100
1,000
Time after change in feed (h)
EPA increase with Tel
DHA increase with Iso
3.5
2.5
~
~ 2
:!
~ I.S
'0
~ 1
;;
~ 0.5
0.
o
EPAwithTet
f '
-
Tetto Iso
~
Tel to Yst
+B
2
Time after cbange in feed (b)
DHA with Iso
C
...
Iso to Tet
~
.
Isoto Yst
.
c,
?'
v
K
' 0
') C,
c
,)
o
Time after change in feed (b)
FIGURE 8.10. Time course kinetics of DHA and EPA in the rotifer B. plicatilis on changes
in dietary lipids. (A) Increase in DHA and EPA with time after replacing Baker's yeast
(Yst) with I. galbana or Tetraselmis sp., respectively, as food. (B) Restoration of EPA after
changing back from Tetraselmis sp. (4-h value from A) to Baker's yeast and I. galbana. (C)
Restoration of DHA after changing back from I. galbana (4-h value from A) to Baker's
yeast or Tetraselmis sp.
DHA. When these cultures were given the algae Isochrysis galbana or Tetraselmis
sp. instead of Baker's yeast, the fatty acid distribution of the rotifers showed rapid
changes (Fig. 8.10).
This strain of I. galbana contained 5-6% DHA (of total fatty acids) and
undetectable quantities of EPA. The Y-rotifers fed this algae showed a logarithmic
increase in DHA content for more than 40 successive days during sustained
feeding (Fig. 8.1 OA), whereas no change in EPA could be detected during the first
day (EPA not shown). More than 60% of the change in percentage DHA of total
fatty acids took place during the first day, and the rate of increase decreased
gradually after the first half-hour of incubation.
The present strain of Tetraselmis sp. contained 8-10% EPA and no detectable
quantities of DHA. Y-rotifers offered this algae showed a logarithmic increase in
percentage EPA for more than 40 d, whereas no changes in DHA took place
during the first day (Fig. 8.lOA, DHA not shown). Also in this case, more than
60% of the changes in percentage EPA took place during day 1.
The steeper slope of the EPA curve compared with the DHA curve (Fig. 8.1 OA)
is noteworthy, and it probably reflects the fact that the percentage EPA in Tetra-