

Fed-Batch Bioproduction of Spectinomycin
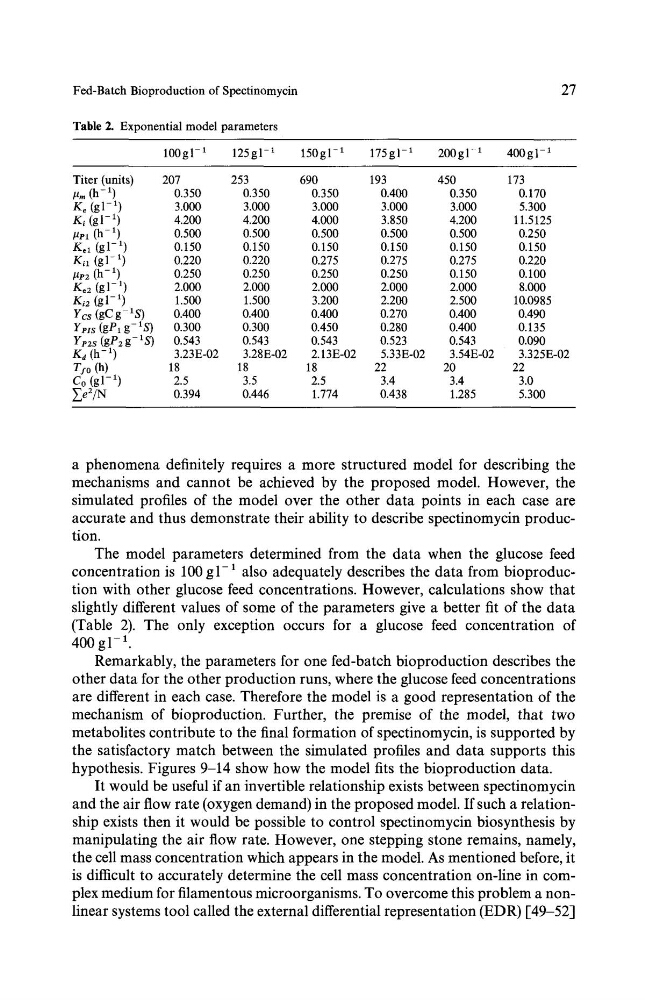
Table 2. Exponential model parameters
27
100gl -x
125gl -1
150gl -1
175gl -1
200gl -x
400g1-1
Titer (units)
207
253
690
193
450
173
p,~ (h- 1)
0.350
0.350
0.350
0.400
0.350
0.170
Ke (gl- 1)
3.000
3.000
3.000
3.000
3.000
5.300
Ki (g1-1)
4.200
4.200
4.000
3.850
4.200
11.5125
#vx (h- 1)
0.500
0.500
0.500
0.500
0.500
0.250
Kel (gl -x)
0.150
0.150
0.150
0.150
0.150
0.150
Kil (gl- 1)
0.220
0.220
0.275
0.275
0.275
0.220
#v2 (h- 1)
0.250
0.250
0.250
0.250
0.150
0.100
Ko2 (g 1-1)
2.000
2.000
2.000
2.000
2.000
8.000
Ki2 (gl -x)
1.500
1.500
3.200
2.200
2.500
10.0985
Ycs (gC g- xS)
0.400
0.400
0.400
0.270
0.400
0.490
Yvls (gP1 g-xS) 0.300
0.300
0.450
0.280
0.400
0.135
Yv2s (gP2 g- 1S) 0.543
0.543
0.543
0.523
0.543
0.090
Ka (h -x)
3.23E-02 3.28E-02 2.13E-02 5.33E-02 3.54E-02 3.325E-02
Ts0 (h)
18
18
18
22
20
22
Co (gl -x)
2.5
3.5
2.5
3.4
3.4
3.0
~e2/N
0.394
0.446
1.774
0.438
1.285
5.300
a phenomena definitely requires a more structured model for describing the
mechanisms and cannot be achieved by the proposed model. However, the
simulated profiles of the model over the other data points in each case are
accurate and thus demonstrate their ability to describe spectinomycin production.
The model parameters determined from the data when the glucose feed
concentration is 100 gl-1 also adequately describes the data from bioproduction with other glucose feed concentrations. However, calculations show that
slightly different values of some of the parameters give a better fit of the data
(Table 2). The only exception occurs for a glucose feed concentration of
400 g 1-1
Remarkably, the parameters for one fed-batch bioproduction describes the
other data for the other production runs, where the glucose feed concentrations
are different in each case. Therefore the model is a good representation of the
mechanism of bioproduction. Further, the premise of the model, that two
metabolites contribute to the final formation of spectinomycin, is supported by
the satisfactory match between the simulated profiles and data supports this
hypothesis. Figures 9-14 show how the model fits the bioproduction data.
It would be useful if an invertible relationship exists between spectinomycin
and the air flow rate (oxygen demand) in the proposed model. If such a relationship exists then it would be possible to control spectinomycin biosynthesis by
manipulating the air flow rate. However, one stepping stone remains, namely,
the cell mass concentration which appears in the model. As mentioned before, it
is difficult to accurately determine the cell mass concentration on-line in complex medium for filamentous microorganisms. To overcome this problem a nonlinear systems tool called the external differential representation (EDR) [49-52]
Table 2. Exponential model parameters
27
100gl -x
125gl -1
150gl -1
175gl -1
200gl -x
400g1-1
Titer (units)
207
253
690
193
450
173
p,~ (h- 1)
0.350
0.350
0.350
0.400
0.350
0.170
Ke (gl- 1)
3.000
3.000
3.000
3.000
3.000
5.300
Ki (g1-1)
4.200
4.200
4.000
3.850
4.200
11.5125
#vx (h- 1)
0.500
0.500
0.500
0.500
0.500
0.250
Kel (gl -x)
0.150
0.150
0.150
0.150
0.150
0.150
Kil (gl- 1)
0.220
0.220
0.275
0.275
0.275
0.220
#v2 (h- 1)
0.250
0.250
0.250
0.250
0.150
0.100
Ko2 (g 1-1)
2.000
2.000
2.000
2.000
2.000
8.000
Ki2 (gl -x)
1.500
1.500
3.200
2.200
2.500
10.0985
Ycs (gC g- xS)
0.400
0.400
0.400
0.270
0.400
0.490
Yvls (gP1 g-xS) 0.300
0.300
0.450
0.280
0.400
0.135
Yv2s (gP2 g- 1S) 0.543
0.543
0.543
0.523
0.543
0.090
Ka (h -x)
3.23E-02 3.28E-02 2.13E-02 5.33E-02 3.54E-02 3.325E-02
Ts0 (h)
18
18
18
22
20
22
Co (gl -x)
2.5
3.5
2.5
3.4
3.4
3.0
~e2/N
0.394
0.446
1.774
0.438
1.285
5.300
a phenomena definitely requires a more structured model for describing the
mechanisms and cannot be achieved by the proposed model. However, the
simulated profiles of the model over the other data points in each case are
accurate and thus demonstrate their ability to describe spectinomycin production.
The model parameters determined from the data when the glucose feed
concentration is 100 gl-1 also adequately describes the data from bioproduction with other glucose feed concentrations. However, calculations show that
slightly different values of some of the parameters give a better fit of the data
(Table 2). The only exception occurs for a glucose feed concentration of
400 g 1-1
Remarkably, the parameters for one fed-batch bioproduction describes the
other data for the other production runs, where the glucose feed concentrations
are different in each case. Therefore the model is a good representation of the
mechanism of bioproduction. Further, the premise of the model, that two
metabolites contribute to the final formation of spectinomycin, is supported by
the satisfactory match between the simulated profiles and data supports this
hypothesis. Figures 9-14 show how the model fits the bioproduction data.
It would be useful if an invertible relationship exists between spectinomycin
and the air flow rate (oxygen demand) in the proposed model. If such a relationship exists then it would be possible to control spectinomycin biosynthesis by
manipulating the air flow rate. However, one stepping stone remains, namely,
the cell mass concentration which appears in the model. As mentioned before, it
is difficult to accurately determine the cell mass concentration on-line in complex medium for filamentous microorganisms. To overcome this problem a nonlinear systems tool called the external differential representation (EDR) [49-52]