

tower loop reactor. In the 60-l airlift tower loop reactor, S184 had no foamsuppressing effect, but VP1133 was very effective. The foaminess was controlled
and maintained below 140 s by the appropriate feeding of VP1133 to the reactor.
Gas holdup, OTR, and respiratory quotient RQ = CPR/OTR varied slightly during
the addition of the AFA. However, the mean bubble velocity increased immediately after the addition of silicone oil containing an AFA to the reactor (Fig. 1).
In Fig. 2 the key parameters are presented for recombinant E. coli batch
cultivation in a 60-l working volume airlift tower loop reactor at constant aeration rate up to 16 h, whereupon the temperature was increased from 30 to 42 °C
and gene expression was induced. At the same time concentrated Luria-Bertani
(LB) medium was added to the reactor. To avoid oxygen limitation, the aeration
rate was increased (Fig. 2a). At 12 h the foaming increased and SE9 was added
to the medium. The bubble velocities (Fig. 2b) and the specific gas/liquid interfacial area (Fig. 2c) quickly increased and passed a narrow maximum, but k L a
dropped and the OTR was not influenced (Fig. 2d). After the induction of the
gene expression by a temperature increase and medium supplement the dissolved oxygen concentration with respect to the saturation increased due to the
elevation of the aeration rate (Fig. 2a); the mean bubble velocity (Fig. 2b) and
specific interfacial area (Fig. 2c) decreased, OTR increased and k L a remained at
low values (Fig. 2d). The mass transfer coefficient with respect to the liquid
phase k L dropped from about 1.67 to 0.67 m s
–1 after the addition of SE9 to the
medium [51].
206
K. Schügerl
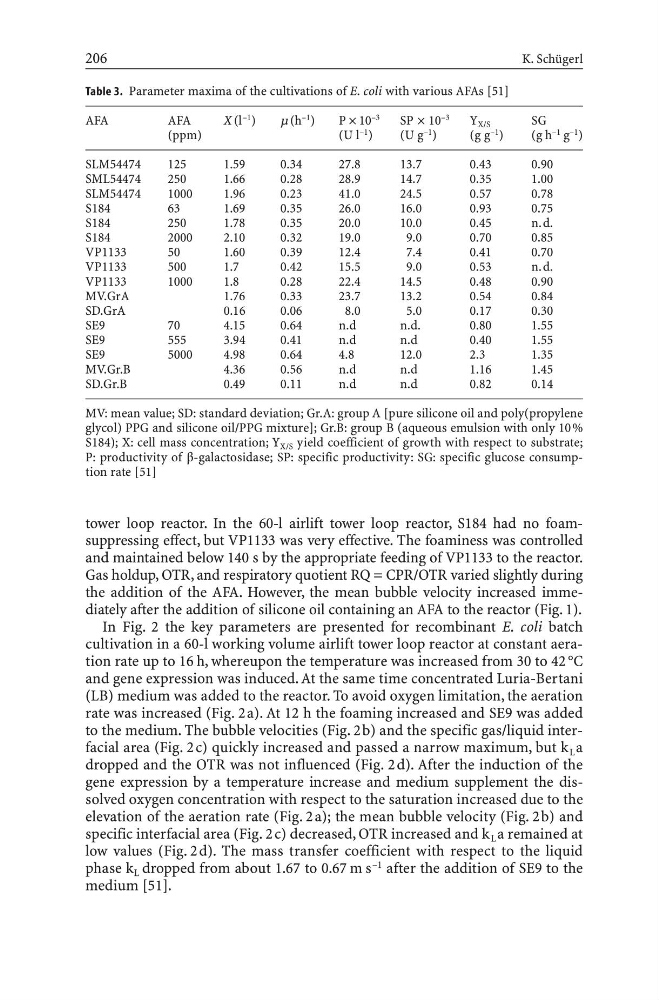
Table 3. Parameter maxima of the cultivations of E. coli with various AFAs [51]
AFA
AFA
X (l –1 )
m (h –1 )
P¥ 10 –3
SP ¥ 10 –3
Y X/S
SG
(ppm)
(U l
–1 )
(U g –1 )
(g g –1 )
(g h –1 g –1 )
SLM54474
125
1.59
0.34
27.8
13.7
0.43
0.90
SML54474
250
1.66
0.28
28.9
14.7
0.35
1.00
SLM54474
1000
1.96
0.23
41.0
24.5
0.57
0.78
S184
63
1.69
0.35
26.0
16.0
0.93
0.75
S184
250
1.78
0.35
20.0
10.0
0.45
n.d.
S184
2000
2.10
0.32
19.0
9.0
0.70
0.85
VP1133
50
1.60
0.39
12.4
7.4
0.41
0.70
VP1133
500
1.7
0.42
15.5
9.0
0.53
n.d.
VP1133
1000
1.8
0.28
22.4
14.5
0.48
0.90
MV.GrA
1.76
0.33
23.7
13.2
0.54
0.84
SD.GrA
0.16
0.06
8.0
5.0
0.17
0.30
SE9
70
4.15
0.64
n.d
n.d.
0.80
1.55
SE9
555
3.94
0.41
n.d
n.d
0.40
1.55
SE9
5000
4.98
0.64
4.8
12.0
2.3
1.35
MV.Gr.B
4.36
0.56
n.d
n.d
1.16
1.45
SD.Gr.B
0.49
0.11
n.d
n.d
0.82
0.14
MV: mean value; SD: standard deviation; Gr.A: group A [pure silicone oil and poly(propylene
glycol) PPG and silicone oil/PPG mixture]; Gr.B: group B (aqueous emulsion with only 10%
S184); X: cell mass concentration; Y X/S yield coefficient of growth with respect to substrate;
P: productivity of b-galactosidase; SP: specific productivity: SG: specific glucose consumption rate [51]
and maintained below 140 s by the appropriate feeding of VP1133 to the reactor.
Gas holdup, OTR, and respiratory quotient RQ = CPR/OTR varied slightly during
the addition of the AFA. However, the mean bubble velocity increased immediately after the addition of silicone oil containing an AFA to the reactor (Fig. 1).
In Fig. 2 the key parameters are presented for recombinant E. coli batch
cultivation in a 60-l working volume airlift tower loop reactor at constant aeration rate up to 16 h, whereupon the temperature was increased from 30 to 42 °C
and gene expression was induced. At the same time concentrated Luria-Bertani
(LB) medium was added to the reactor. To avoid oxygen limitation, the aeration
rate was increased (Fig. 2a). At 12 h the foaming increased and SE9 was added
to the medium. The bubble velocities (Fig. 2b) and the specific gas/liquid interfacial area (Fig. 2c) quickly increased and passed a narrow maximum, but k L a
dropped and the OTR was not influenced (Fig. 2d). After the induction of the
gene expression by a temperature increase and medium supplement the dissolved oxygen concentration with respect to the saturation increased due to the
elevation of the aeration rate (Fig. 2a); the mean bubble velocity (Fig. 2b) and
specific interfacial area (Fig. 2c) decreased, OTR increased and k L a remained at
low values (Fig. 2d). The mass transfer coefficient with respect to the liquid
phase k L dropped from about 1.67 to 0.67 m s
–1 after the addition of SE9 to the
medium [51].
206
K. Schügerl
Table 3. Parameter maxima of the cultivations of E. coli with various AFAs [51]
AFA
AFA
X (l –1 )
m (h –1 )
P¥ 10 –3
SP ¥ 10 –3
Y X/S
SG
(ppm)
(U l
–1 )
(U g –1 )
(g g –1 )
(g h –1 g –1 )
SLM54474
125
1.59
0.34
27.8
13.7
0.43
0.90
SML54474
250
1.66
0.28
28.9
14.7
0.35
1.00
SLM54474
1000
1.96
0.23
41.0
24.5
0.57
0.78
S184
63
1.69
0.35
26.0
16.0
0.93
0.75
S184
250
1.78
0.35
20.0
10.0
0.45
n.d.
S184
2000
2.10
0.32
19.0
9.0
0.70
0.85
VP1133
50
1.60
0.39
12.4
7.4
0.41
0.70
VP1133
500
1.7
0.42
15.5
9.0
0.53
n.d.
VP1133
1000
1.8
0.28
22.4
14.5
0.48
0.90
MV.GrA
1.76
0.33
23.7
13.2
0.54
0.84
SD.GrA
0.16
0.06
8.0
5.0
0.17
0.30
SE9
70
4.15
0.64
n.d
n.d.
0.80
1.55
SE9
555
3.94
0.41
n.d
n.d
0.40
1.55
SE9
5000
4.98
0.64
4.8
12.0
2.3
1.35
MV.Gr.B
4.36
0.56
n.d
n.d
1.16
1.45
SD.Gr.B
0.49
0.11
n.d
n.d
0.82
0.14
MV: mean value; SD: standard deviation; Gr.A: group A [pure silicone oil and poly(propylene
glycol) PPG and silicone oil/PPG mixture]; Gr.B: group B (aqueous emulsion with only 10%
S184); X: cell mass concentration; Y X/S yield coefficient of growth with respect to substrate;
P: productivity of b-galactosidase; SP: specific productivity: SG: specific glucose consumption rate [51]