

74
M. WILM et al.
manually the readout of the amino acid sequence was fast and free of errors.
Manual interpretation is superior because it allows to use all the information
available, the difference between the 16 0/ 18 0 and the 18 0 spectrum, the typical
isotopic distribution of labelled y ions and additional N-terminal fragment ions
in the spectrum.
The differential scanning technique increases the information content of a tandem mass spectrum of a peptide. It allows to filter out y ions from a background
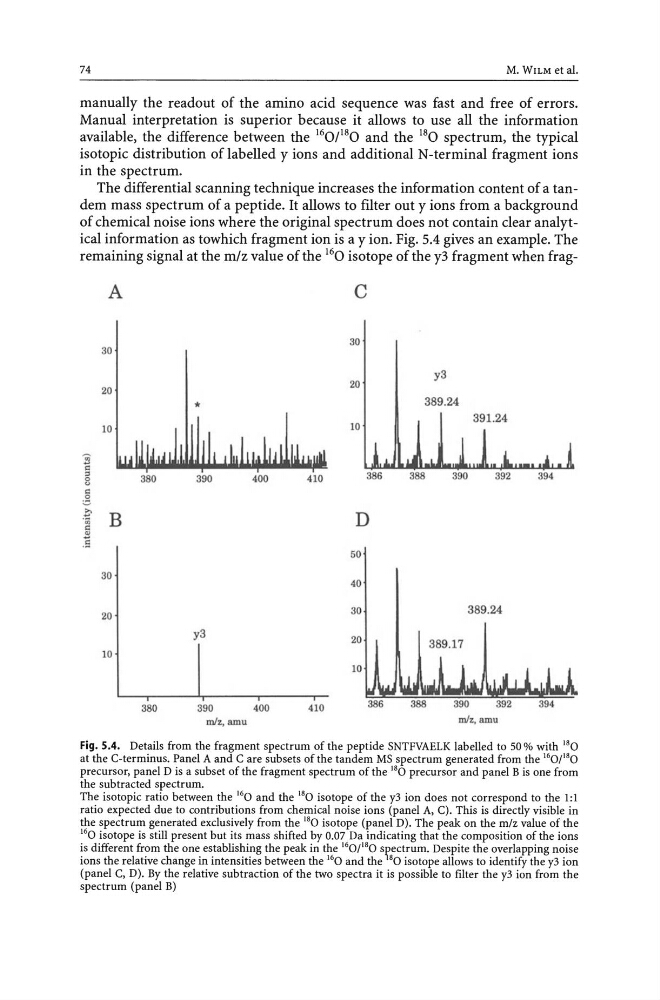
of chemical noise ions where the original spectrum does not contain clear analytical information as towhich fragment ion is a y ion. Fig. 5.4 gives an example. The
remaining signal at the m/z value of the 16 0 isotope of the y3 fragment when fragA
C
30
30
20
20
y3
*
389.24
391.24
10
10
!i c
"
380
0
"
410
386
390
400
c
~
. ~ B
c
D
2!
.=
50
30
40
20
30
389.24
y3
20
389.17
10
10
380
390
400
410
m1z, amu
mh.awu
Fig. 5.4. Details from the fragment spectrum of the peptide SNTFVAELK labelled to 50 % with 18 0
at the C-terminus. Panel A and C are subsets of the tandem MS spectrum generated from the 16 0/ 18 0
precursor, panel D is a subset of the fragment spectrum of the 18 0 precursor and panel B is one from
the subtracted spectrum.
The isotopic ratio between the 16 0 and the 18 0 isotope of the y3 ion does not correspond to the 1: 1
ratio expected due to contributions from chemical noise ions (panel A, C). This is directly visible in
the spectrum generated exclusively from the 18 0 isotope (panel D). The peak on the mlz value of the
16 0 isotope is still present but its mass shifted by 0.07 Da indicating that the composition of the ions
is different from the one establishing the peak in the 16 0/ 18 0 sr,ectrum. Despite the overlapping noise
ions the relative change in intensities between the 16 0 and the 80 isotope allows to identify the y3 ion
(panel C, D). By the relative subtraction of the two spectra it is possible to filter the y3 ion from the
spectrum (panel B)
M. WILM et al.
manually the readout of the amino acid sequence was fast and free of errors.
Manual interpretation is superior because it allows to use all the information
available, the difference between the 16 0/ 18 0 and the 18 0 spectrum, the typical
isotopic distribution of labelled y ions and additional N-terminal fragment ions
in the spectrum.
The differential scanning technique increases the information content of a tandem mass spectrum of a peptide. It allows to filter out y ions from a background
of chemical noise ions where the original spectrum does not contain clear analytical information as towhich fragment ion is a y ion. Fig. 5.4 gives an example. The
remaining signal at the m/z value of the 16 0 isotope of the y3 fragment when fragA
C
30
30
20
20
y3
*
389.24
391.24
10
10
!i c
"
380
0
"
410
386
390
400
c
~
. ~ B
c
D
2!
.=
50
30
40
20
30
389.24
y3
20
389.17
10
10
380
390
400
410
m1z, amu
mh.awu
Fig. 5.4. Details from the fragment spectrum of the peptide SNTFVAELK labelled to 50 % with 18 0
at the C-terminus. Panel A and C are subsets of the tandem MS spectrum generated from the 16 0/ 18 0
precursor, panel D is a subset of the fragment spectrum of the 18 0 precursor and panel B is one from
the subtracted spectrum.
The isotopic ratio between the 16 0 and the 18 0 isotope of the y3 ion does not correspond to the 1: 1
ratio expected due to contributions from chemical noise ions (panel A, C). This is directly visible in
the spectrum generated exclusively from the 18 0 isotope (panel D). The peak on the mlz value of the
16 0 isotope is still present but its mass shifted by 0.07 Da indicating that the composition of the ions
is different from the one establishing the peak in the 16 0/ 18 0 sr,ectrum. Despite the overlapping noise
ions the relative change in intensities between the 16 0 and the 80 isotope allows to identify the y3 ion
(panel C, D). By the relative subtraction of the two spectra it is possible to filter the y3 ion from the
spectrum (panel B)