

De novo Sequencing of Proteins With Mass Spectrometry
A
a2
60
50
b2
]
3
8 40
"
~
~ 30
';;
y2
c
2l
.S
20
/
y4
y6
yl
y3
y7
y9
y5
y8
ylO yll
10
200
400
600
800
1000
1200
mh.amu
B
D
y3
a2
60
b2
40
y6
20
20 j
331 20
" , L ".JJ' " .
328
330
332
334
C
E
y6
333.20
::1
y2
y5
, I ::1
~L," l
, II
y3
y4
, I
!
I . , I, ,
.1 ..... l ,l
.1
200
300
400
500
600
328
330
332
334
mh . . ,a mu
mlzJamu
y12
1400
"
336
J. "
336
73
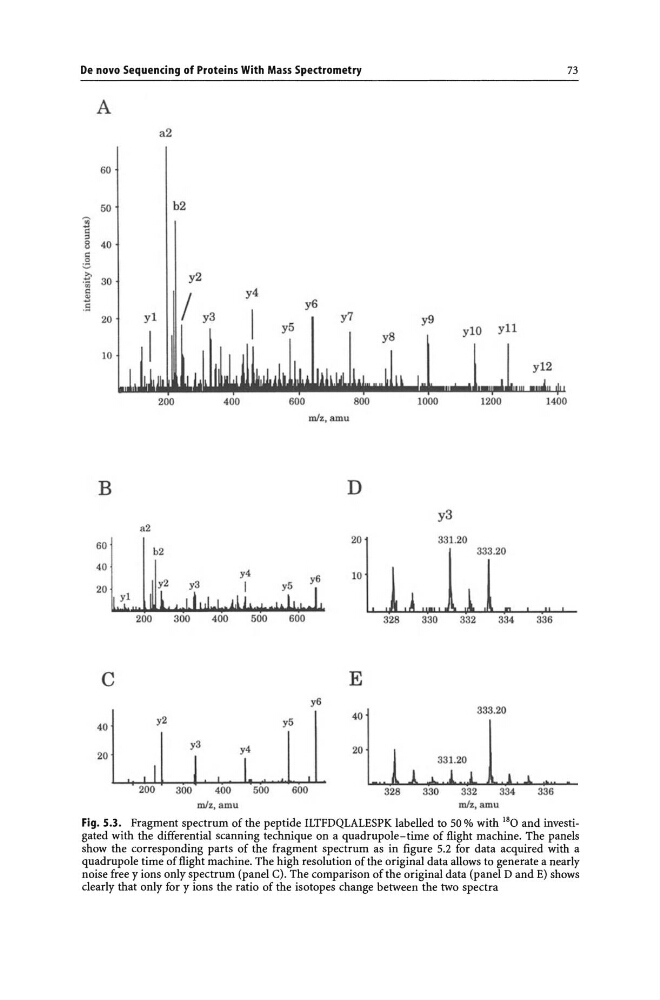
Fig. 5.3. Fragment spectrum of the peptide ILTFDQLALESPK labelled to 50 % with 18 0 and investigated with the differential scanning technique on a quadrupole-time of flight machine. The panels
show the corresponding parts of the fragment spectrum as in figure 5.2 for data acquired with a
quadrupole time of flight machine. The high resolution of the original data allows to generate a nearly
noise free y ions only spectrum (panel C). The comparison of the original data (panel D and E) shows
clearly that only for y ions the ratio of the isotopes change between the two spectra
A
a2
60
50
b2
]
3
8 40
"
~
~ 30
';;
y2
c
2l
.S
20
/
y4
y6
yl
y3
y7
y9
y5
y8
ylO yll
10
200
400
600
800
1000
1200
mh.amu
B
D
y3
a2
60
b2
40
y6
20
20 j
331 20
" , L ".JJ' " .
328
330
332
334
C
E
y6
333.20
::1
y2
y5
, I ::1
~L," l
, II
y3
y4
, I
!
I . , I, ,
.1 ..... l ,l
.1
200
300
400
500
600
328
330
332
334
mh . . ,a mu
mlzJamu
y12
1400
"
336
J. "
336
73
Fig. 5.3. Fragment spectrum of the peptide ILTFDQLALESPK labelled to 50 % with 18 0 and investigated with the differential scanning technique on a quadrupole-time of flight machine. The panels
show the corresponding parts of the fragment spectrum as in figure 5.2 for data acquired with a
quadrupole time of flight machine. The high resolution of the original data allows to generate a nearly
noise free y ions only spectrum (panel C). The comparison of the original data (panel D and E) shows
clearly that only for y ions the ratio of the isotopes change between the two spectra