

62
100
50
250 ng Total Protein Ribo ome 60s
k,1 , J' I, I.i .
5
10
15
I.,.
, , .. I"
10
J. R. YATES et al.
No all
4.26E8
20
25
30
35
40
No Salt
6.38E6
I,,!!!. !
20
25
7.76E7
7.02E7
20-30% 250 mM KCI
24
26
28
30
1.98E6
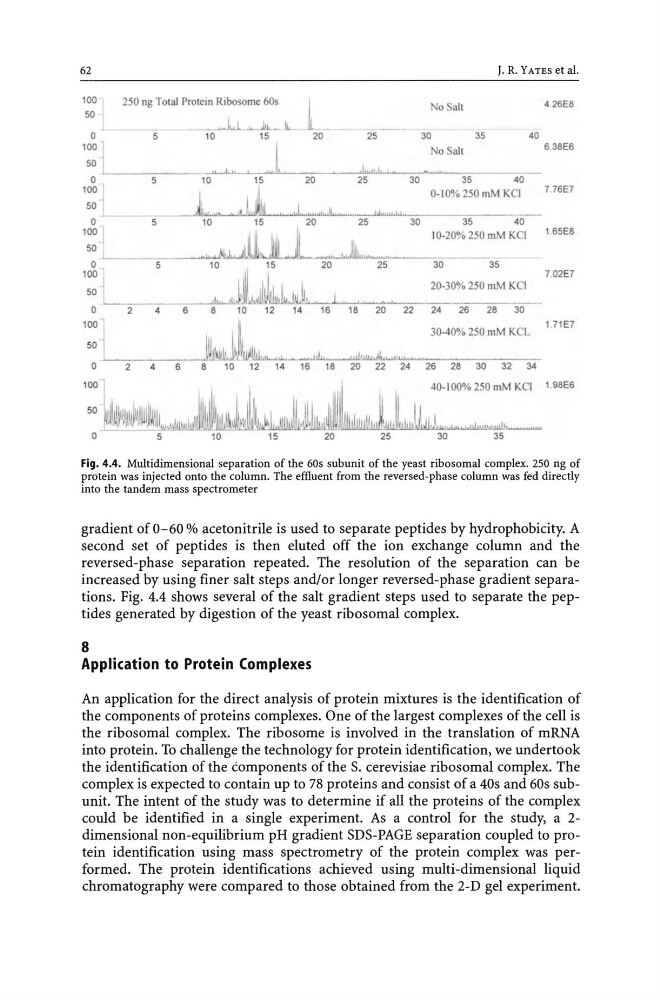
Fig. 4.4. Multidimensional separation of the 60s subunit of the yeast ribosomal complex. 250 ng of
protein was injected onto the column. The effluent from the reversed-phase column was fed directly
into the tandem mass spectrometer
gradient of 0-60 % acetonitrile is used to separate peptides by hydrophobicity. A
second set of peptides is then eluted off the ion exchange column and the
reversed-phase separation repeated. The resolution of the separation can be
increased by using finer salt steps and/or longer reversed-phase gradient separations. Fig. 4.4 shows several of the salt gradient steps used to separate the peptides generated by digestion of the yeast ribosomal complex.
8
Application to Protein Complexes
An application for the direct analysis of protein mixtures is the identification of
the components of proteins complexes. One of the largest complexes of the cell is
the ribosomal complex. The ribosome is involved in the translation of mRNA
into protein. To challenge the technology for protein identification, we undertook
the identification of the components of the S. cerevisiae ribosomal complex. The
complex is expected to contain up to 78 proteins and consist of a 40s and 60s subunit. The intent of the study was to determine if all the proteins of the complex
could be identified in a single experiment. As a control for the study, a 2dimensional non-equilibrium pH gradient SDS-PAGE separation coupled to protein identification using mass spectrometry of the protein complex was performed. The protein identifications achieved using multi-dimensional liquid
chromatography were compared to those obtained from the 2-D gel experiment.
100
50
250 ng Total Protein Ribo ome 60s
k,1 , J' I, I.i .
5
10
15
I.,.
, , .. I"
10
J. R. YATES et al.
No all
4.26E8
20
25
30
35
40
No Salt
6.38E6
I,,!!!. !
20
25
7.76E7
7.02E7
20-30% 250 mM KCI
24
26
28
30
1.98E6
Fig. 4.4. Multidimensional separation of the 60s subunit of the yeast ribosomal complex. 250 ng of
protein was injected onto the column. The effluent from the reversed-phase column was fed directly
into the tandem mass spectrometer
gradient of 0-60 % acetonitrile is used to separate peptides by hydrophobicity. A
second set of peptides is then eluted off the ion exchange column and the
reversed-phase separation repeated. The resolution of the separation can be
increased by using finer salt steps and/or longer reversed-phase gradient separations. Fig. 4.4 shows several of the salt gradient steps used to separate the peptides generated by digestion of the yeast ribosomal complex.
8
Application to Protein Complexes
An application for the direct analysis of protein mixtures is the identification of
the components of proteins complexes. One of the largest complexes of the cell is
the ribosomal complex. The ribosome is involved in the translation of mRNA
into protein. To challenge the technology for protein identification, we undertook
the identification of the components of the S. cerevisiae ribosomal complex. The
complex is expected to contain up to 78 proteins and consist of a 40s and 60s subunit. The intent of the study was to determine if all the proteins of the complex
could be identified in a single experiment. As a control for the study, a 2dimensional non-equilibrium pH gradient SDS-PAGE separation coupled to protein identification using mass spectrometry of the protein complex was performed. The protein identifications achieved using multi-dimensional liquid
chromatography were compared to those obtained from the 2-D gel experiment.