

132
a.i.
25000
20000
15000
10000
5000
o
25000
20000
15000
10000
5000
o
25000
20000
15000
10000
5000
o
A
1 2 3 4 5 6 7
ss
{FlvrlSls~lb s N N~W
8 9 1011 S 12 1314
S
A Ie K
3
2
B ~r----SS~
N F V ~ S II Ie S N N PTe W
I
----s-'-16
~15
A Ie K
C 22123
21
Nlc;jl
~leK
24
20
r----SS~
eSNNPTew
200
400
600
800
1000
1200
J. J. GORMAN et al.
MW
10
MW
MW
2223
1400
1600
1800
2000 m/z
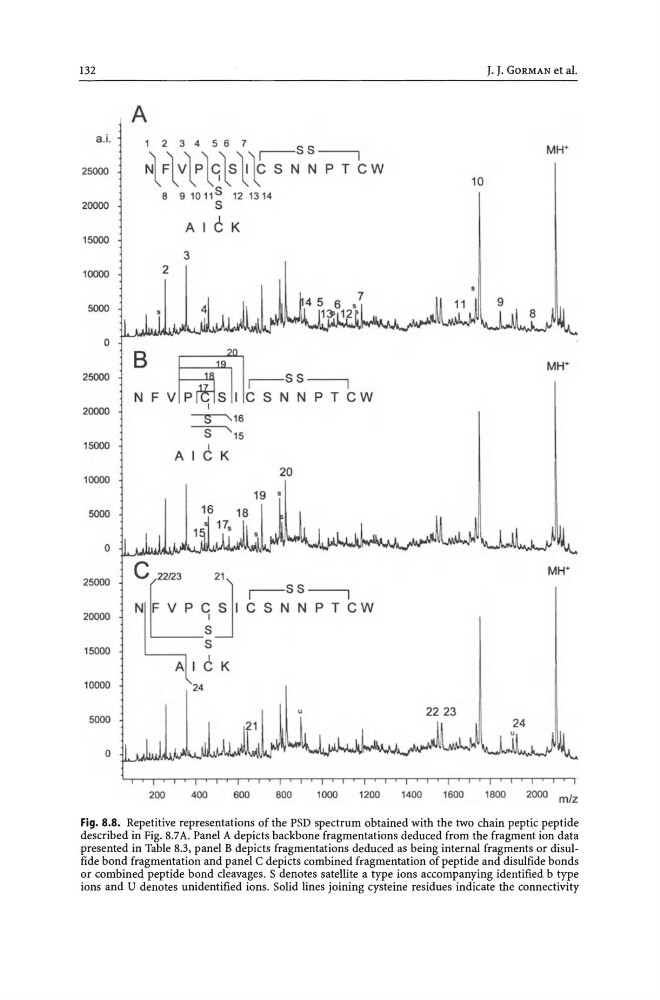
Fig. S.S. Repetitive representations of the PSD spectrum obtained with the two chain peptic peptide
described in Fig. 8.7 A. Panel A depicts backbone fragmentations deduced from the fragment ion data
presented in Table 8.3, panel B depicts fragmentations deduced as being internal fragments or disulfide bond fragmentation and panel C depicts combined fragmentation of peptide and disulfide bonds
or combined peptide bond cleavages. S denotes satellite a type ions accompanying identified b type
ions and U denotes unidentified ions. Solid lines joining cysteine residues indicate the connectivity
a.i.
25000
20000
15000
10000
5000
o
25000
20000
15000
10000
5000
o
25000
20000
15000
10000
5000
o
A
1 2 3 4 5 6 7
ss
{FlvrlSls~lb s N N~W
8 9 1011 S 12 1314
S
A Ie K
3
2
B ~r----SS~
N F V ~ S II Ie S N N PTe W
I
----s-'-16
~15
A Ie K
C 22123
21
Nlc;jl
~leK
24
20
r----SS~
eSNNPTew
200
400
600
800
1000
1200
J. J. GORMAN et al.
MW
10
MW
MW
2223
1400
1600
1800
2000 m/z
Fig. S.S. Repetitive representations of the PSD spectrum obtained with the two chain peptic peptide
described in Fig. 8.7 A. Panel A depicts backbone fragmentations deduced from the fragment ion data
presented in Table 8.3, panel B depicts fragmentations deduced as being internal fragments or disulfide bond fragmentation and panel C depicts combined fragmentation of peptide and disulfide bonds
or combined peptide bond cleavages. S denotes satellite a type ions accompanying identified b type
ions and U denotes unidentified ions. Solid lines joining cysteine residues indicate the connectivity