

264
J. A. J. STOLWIJK
to a considerable intent related to better insight as to which components
need to be represented accurately and in detail, and which can be lumped
into an equivalent component. Thus it can be important to differentiate the
hands from the arms, but it will usually not be necessary to distinguish the
left hand from the right hand.
Energy
i
r -- Controlling system
I
I
I
I
I
Disturbance
j
t--~-t Controlled system
I
I
Feedback signal
I
_______________________ J
Fig. 1. Block diagram of simple control system. Broken lines represent signal
paths; drawn lines depict power transfer
The Controlled System in Human Thermoregulation
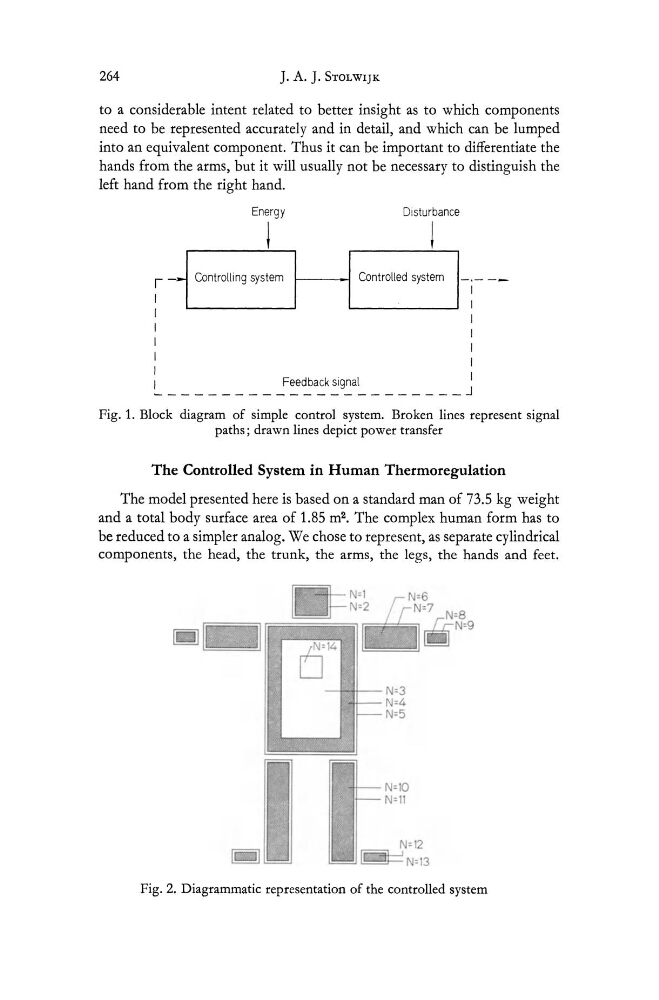
The model presented here is based on a standard man of 73.5 kg weight
and a total body surface area of 1.85 m 2 • The complex human form has to
be reduced to a simpler analog. We chose to represent, as separate cylindrical
components, the head, the trunk, the arms, the legs, the hands and feet.
~IL",,·]I
N=6
N=7 N=B
~~IiN:9
6:
14
--II-tlf--- N:3
N:4
N;5
N=12
N=13
Fig. 2. Diagrammatic representation of the controlled system
J. A. J. STOLWIJK
to a considerable intent related to better insight as to which components
need to be represented accurately and in detail, and which can be lumped
into an equivalent component. Thus it can be important to differentiate the
hands from the arms, but it will usually not be necessary to distinguish the
left hand from the right hand.
Energy
i
r -- Controlling system
I
I
I
I
I
Disturbance
j
t--~-t Controlled system
I
I
Feedback signal
I
_______________________ J
Fig. 1. Block diagram of simple control system. Broken lines represent signal
paths; drawn lines depict power transfer
The Controlled System in Human Thermoregulation
The model presented here is based on a standard man of 73.5 kg weight
and a total body surface area of 1.85 m 2 • The complex human form has to
be reduced to a simpler analog. We chose to represent, as separate cylindrical
components, the head, the trunk, the arms, the legs, the hands and feet.
~IL",,·]I
N=6
N=7 N=B
~~IiN:9
6:
14
--II-tlf--- N:3
N:4
N;5
N=12
N=13
Fig. 2. Diagrammatic representation of the controlled system