

Rat Liver Mitochondria in Relation to Age
149
Table 2
A: Number of mitochondria per unit of sectioned cell area in group Y
Source of variance
dJ.
M.S.
S.S.
F
P
between animals
within animals
within group
21
198
219
15293
16046
31339
728.24
81.04
8.99 <0.001
B: Number of mitochondria per unit of sectioned cell area in group 0
between animals
19
37509.2
1 974.17
9.83 <0.001
within animals
180
36138.7
200.77
within group
199
73647.9
C: Mitochondrial section areas in group Y
between animals
21
1656077.95
78860.85
23.59 <0.001
within animals
9544
31897619.70
3104.28
within group
9565
33553697.65
between plates
19
2170589.30
9911.36
3,10 <0.001
within plates
9325
29727030.40
3 187.88
within animals
9544
31897619.70
D: Mitochondrial section areas in group 0
between animals
19
1678842.34
88360.12
39.54 <0.001
within animals
11 775
26313 179.15
2234.66
within group
11 794
27 992 021.49
between plates
199
708644.75
3561.02
1.60 <0.001
within plates
11 576
25 604 534.40
2211.86
within animals
11 775
26313 179.15
E: Total mitochondrial section areas per unit of sectioned cell
area in group Y
between animals
21
66 711 907.30
3 176757.49
5.33 <0.001
within animals
198 117992 764.90
595923.05
within group
219 184704672.25
F: Total mitochondrial section areas per unit of sectioned cell
area in group 0
between animals
19 298616660.9
15 716 666.36
17.16 <0.001
within animals
180 164867629.5
915931.27
within group
199 463 484 290.4
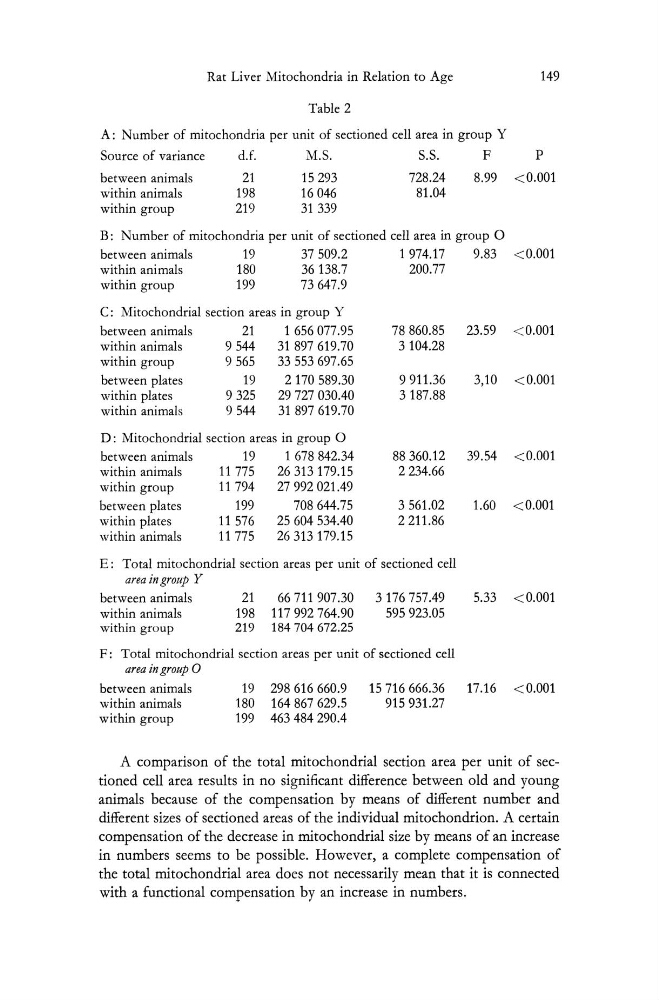
A comparison of the total mitochondrial section area per unit of sectioned cell area results in no significant difference between old and young
animals because of the compensation by means of different number and
different sizes of sectioned areas of the individual mitochondrion. A certain
compensation of the decrease in mitochondrial size by means of an increase
in numbers seems to be possible. However, a complete compensation of
the total mitochondrial area does not necessarily mean that it is connected
with a functional compensation by an increase in numbers.
149
Table 2
A: Number of mitochondria per unit of sectioned cell area in group Y
Source of variance
dJ.
M.S.
S.S.
F
P
between animals
within animals
within group
21
198
219
15293
16046
31339
728.24
81.04
8.99 <0.001
B: Number of mitochondria per unit of sectioned cell area in group 0
between animals
19
37509.2
1 974.17
9.83 <0.001
within animals
180
36138.7
200.77
within group
199
73647.9
C: Mitochondrial section areas in group Y
between animals
21
1656077.95
78860.85
23.59 <0.001
within animals
9544
31897619.70
3104.28
within group
9565
33553697.65
between plates
19
2170589.30
9911.36
3,10 <0.001
within plates
9325
29727030.40
3 187.88
within animals
9544
31897619.70
D: Mitochondrial section areas in group 0
between animals
19
1678842.34
88360.12
39.54 <0.001
within animals
11 775
26313 179.15
2234.66
within group
11 794
27 992 021.49
between plates
199
708644.75
3561.02
1.60 <0.001
within plates
11 576
25 604 534.40
2211.86
within animals
11 775
26313 179.15
E: Total mitochondrial section areas per unit of sectioned cell
area in group Y
between animals
21
66 711 907.30
3 176757.49
5.33 <0.001
within animals
198 117992 764.90
595923.05
within group
219 184704672.25
F: Total mitochondrial section areas per unit of sectioned cell
area in group 0
between animals
19 298616660.9
15 716 666.36
17.16 <0.001
within animals
180 164867629.5
915931.27
within group
199 463 484 290.4
A comparison of the total mitochondrial section area per unit of sectioned cell area results in no significant difference between old and young
animals because of the compensation by means of different number and
different sizes of sectioned areas of the individual mitochondrion. A certain
compensation of the decrease in mitochondrial size by means of an increase
in numbers seems to be possible. However, a complete compensation of
the total mitochondrial area does not necessarily mean that it is connected
with a functional compensation by an increase in numbers.