

148
D. ADAMIKER
Table 1
A) Number of Mitochondria per 56.25 1'2 of sectioned cell area
Statistical parameter
n
x
sx
Py
B) Mitochondrial section area in 1'2
nrn
x
Sx
Py
group Y
220
43.5
0.81
9566
0.331
0.0023
group 0
200
59.0
1.36
~ 0.001
11 795
0.253
0.0017
~ 0.001
C) Total mitochondrial section area in 1'2 per 56,25 1'2 sectioned cell area
n
220
200
x
14.386
14.947
Sx
0.2293
0.3997
Py
< 0.4
n number of sectioned cell areas investigated
nm number of mitochondrial section areas investigated
x mean
Sj( standard error of the mean
P probability
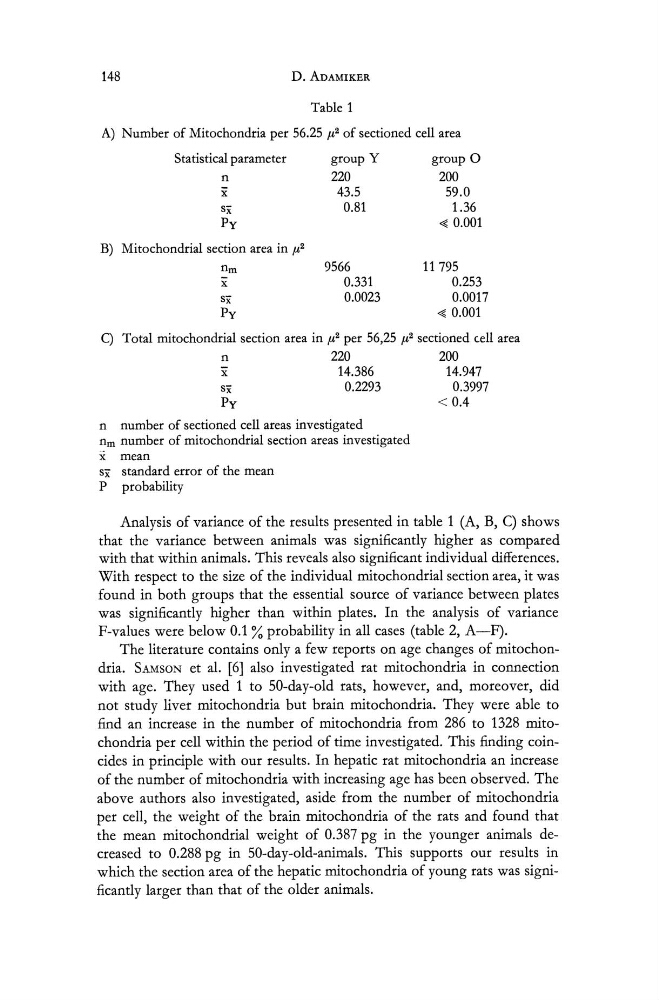
Analysis of variance of the results presented in table 1 (A, B, C) shows
that the variance between animals was significantly higher as compared
with that within animals. This reveals also significant individual differences.
With respect to the size of the individual mitochondrial section area, it was
found in both groups that the essential source of variance between plates
was significantly higher than within plates. In the analysis of variance
F-values were below 0.1 % probability in all cases (table 2, A-F).
The literature contains only a few reports on age changes of mitochondria. SAMSON et al. [6] also investigated rat mitochondria in connection
with age. They used 1 to 50-day-old rats, however, and, moreover, did
not study liver mitochondria but brain mitochondria. They were able to
find an increase in the number of mitochondria from 286 to 1328 mitochondria per cell within the period of time investigated. This finding coincides in principle with our results. In hepatic rat mitochondria an increase
of the number of mitochondria with increasing age has been observed. The
above authors also investigated, aside from the number of mitochondria
per cell, the weight of the brain mitochondria of the rats and found that
the mean mitochondrial weight of 0.387 pg in the younger animals decreased to 0.288 pg in SO-day-old-animals. This supports our results in
which the section area of the hepatic mitochondria of young rats was significantly larger than that of the older animals.
D. ADAMIKER
Table 1
A) Number of Mitochondria per 56.25 1'2 of sectioned cell area
Statistical parameter
n
x
sx
Py
B) Mitochondrial section area in 1'2
nrn
x
Sx
Py
group Y
220
43.5
0.81
9566
0.331
0.0023
group 0
200
59.0
1.36
~ 0.001
11 795
0.253
0.0017
~ 0.001
C) Total mitochondrial section area in 1'2 per 56,25 1'2 sectioned cell area
n
220
200
x
14.386
14.947
Sx
0.2293
0.3997
Py
< 0.4
n number of sectioned cell areas investigated
nm number of mitochondrial section areas investigated
x mean
Sj( standard error of the mean
P probability
Analysis of variance of the results presented in table 1 (A, B, C) shows
that the variance between animals was significantly higher as compared
with that within animals. This reveals also significant individual differences.
With respect to the size of the individual mitochondrial section area, it was
found in both groups that the essential source of variance between plates
was significantly higher than within plates. In the analysis of variance
F-values were below 0.1 % probability in all cases (table 2, A-F).
The literature contains only a few reports on age changes of mitochondria. SAMSON et al. [6] also investigated rat mitochondria in connection
with age. They used 1 to 50-day-old rats, however, and, moreover, did
not study liver mitochondria but brain mitochondria. They were able to
find an increase in the number of mitochondria from 286 to 1328 mitochondria per cell within the period of time investigated. This finding coincides in principle with our results. In hepatic rat mitochondria an increase
of the number of mitochondria with increasing age has been observed. The
above authors also investigated, aside from the number of mitochondria
per cell, the weight of the brain mitochondria of the rats and found that
the mean mitochondrial weight of 0.387 pg in the younger animals decreased to 0.288 pg in SO-day-old-animals. This supports our results in
which the section area of the hepatic mitochondria of young rats was significantly larger than that of the older animals.