

Thermogenesis of Brown Fat in Hibernation and Cold Adaptation
109
in vivo and (2) the metabolic rate of the tissue was linear with brown fat
temperature. Accordingly, oxygen consumption in vivo at 37°C was obtained
from the maximum q02 of brown fat slices incubated in vitro with catecholamines at 37°C. Using these data, equations describing the rate of oxygen
consumption of the tissue as a function of arousal time were derived from
the "warming" curves (cf. Figure 2). By integration, the amount of oxygen
utilized by the brown fat over given time intervals was calculated and compared to the total body heat production.
r ]:A -r:-: B -l- c -pol-I-- - D-~ 14
I
12
I
10 ~
40~
u
!
'L 35 r
~
~ 30~
Ql
a..
~ 25 ~
f
I
20 ~
l
15 r
10 ~
5L
."
,
... -'
"
Axillary brown
fat temperature
\
I-~\
/ .... / ' /\~--~~.~,~,~,,::,
I
"
I
: '
I
:
I
:
I
'
I
:
I
'
I
:
" :"
/
Colonic
,/
temperature
",
8
6
4
2
0
oi~: ~--~~--~~~--~~~
o 25 50 75 100 125 150 175 200 225
Time of arousal (min)
c
'E
-I c
Sa.. E
:J
(J)
C
0
u
0""
l\1
.§
C
til
Ql
(5
..c
~
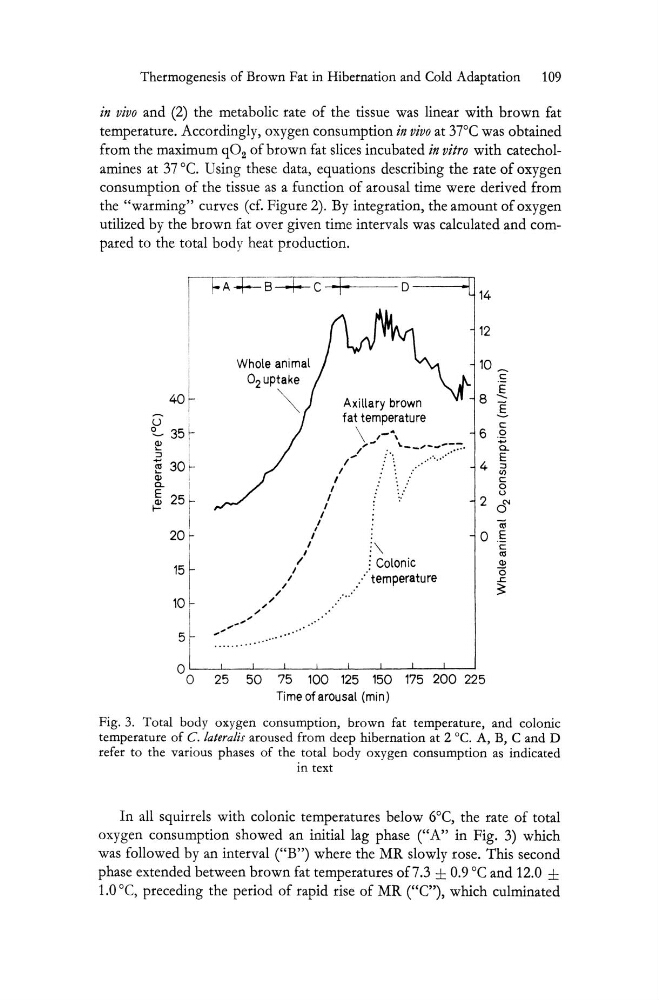
Fig, 3. Total body oxygen consumption, brown fat temperature, and colonic
temperature of C. lateralis aroused from deep hibernation at 2 0c. A, B, C and D
refer to the various phases of the total body oxygen consumption as indicated
in text
In all squirrels with colonic temperatures below 6°C, the rate of total
oxygen consumption showed an initial lag phase ("A" in Fig. 3) which
was followed by an interval ("B") where the MR slowly rose. This second
phase extended between brown fat temperatures of7.3 ± 0.9 °C and 12.0 ±
1.0°C, preceding the period of rapid rise of MR ("C"), which culminated
109
in vivo and (2) the metabolic rate of the tissue was linear with brown fat
temperature. Accordingly, oxygen consumption in vivo at 37°C was obtained
from the maximum q02 of brown fat slices incubated in vitro with catecholamines at 37°C. Using these data, equations describing the rate of oxygen
consumption of the tissue as a function of arousal time were derived from
the "warming" curves (cf. Figure 2). By integration, the amount of oxygen
utilized by the brown fat over given time intervals was calculated and compared to the total body heat production.
r ]:A -r:-: B -l- c -pol-I-- - D-~ 14
I
12
I
10 ~
40~
u
!
'L 35 r
~
~ 30~
Ql
a..
~ 25 ~
f
I
20 ~
l
15 r
10 ~
5L
."
,
... -'
"
Axillary brown
fat temperature
\
I-~\
/ .... / ' /\~--~~.~,~,~,,::,
I
"
I
: '
I
:
I
:
I
'
I
:
I
'
I
:
" :"
/
Colonic
,/
temperature
",
8
6
4
2
0
oi~: ~--~~--~~~--~~~
o 25 50 75 100 125 150 175 200 225
Time of arousal (min)
c
'E
-I c
Sa.. E
:J
(J)
C
0
u
0""
l\1
.§
C
til
Ql
(5
..c
~
Fig, 3. Total body oxygen consumption, brown fat temperature, and colonic
temperature of C. lateralis aroused from deep hibernation at 2 0c. A, B, C and D
refer to the various phases of the total body oxygen consumption as indicated
in text
In all squirrels with colonic temperatures below 6°C, the rate of total
oxygen consumption showed an initial lag phase ("A" in Fig. 3) which
was followed by an interval ("B") where the MR slowly rose. This second
phase extended between brown fat temperatures of7.3 ± 0.9 °C and 12.0 ±
1.0°C, preceding the period of rapid rise of MR ("C"), which culminated