

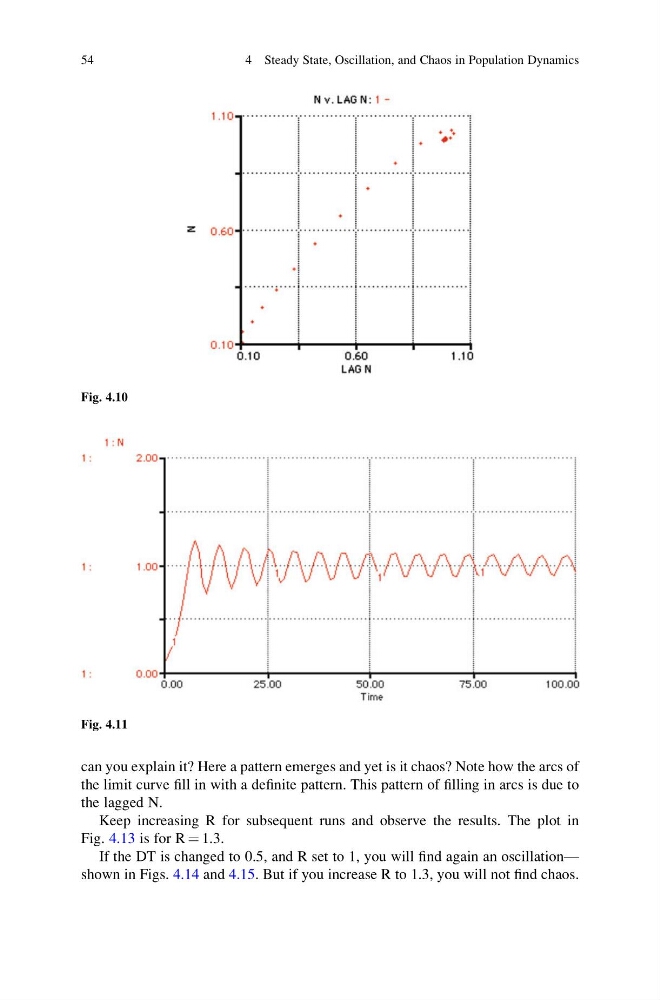
can you explain it? Here a pattern emerges and yet is it chaos? Note how the arcs of
the limit curve fill in with a definite pattern. This pattern of filling in arcs is due to
the lagged N.
Keep increasing R for subsequent runs and observe the results. The plot in
Fig. 4.13 is for R ¼ 1.3.
If the DT is changed to 0.5, and R set to 1, you will find again an oscillation—
shown in Figs. 4.14 and 4.15. But if you increase R to 1.3, you will not find chaos.
Fig. 4.10
Fig. 4.11
54
4 Steady State, Oscillation, and Chaos in Population Dynamics
the limit curve fill in with a definite pattern. This pattern of filling in arcs is due to
the lagged N.
Keep increasing R for subsequent runs and observe the results. The plot in
Fig. 4.13 is for R ¼ 1.3.
If the DT is changed to 0.5, and R set to 1, you will find again an oscillation—
shown in Figs. 4.14 and 4.15. But if you increase R to 1.3, you will not find chaos.
Fig. 4.10
Fig. 4.11
54
4 Steady State, Oscillation, and Chaos in Population Dynamics