

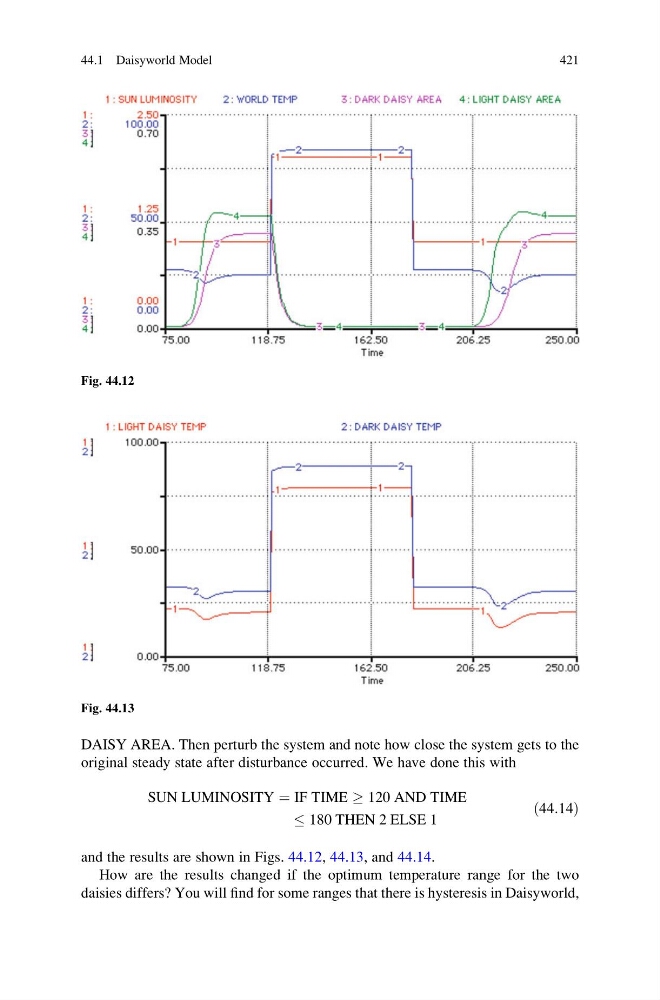
DAISY AREA. Then perturb the system and note how close the system gets to the
original steady state after disturbance occurred. We have done this with
SUN LUMINOSITY ¼ IF TIME ! 120 AND TIME
180 THEN 2 ELSE 1
ð44:14Þ
and the results are shown in Figs. 44.12, 44.13, and 44.14.
How are the results changed if the optimum temperature range for the two
daisies differs? You will find for some ranges that there is hysteresis in Daisyworld,
Fig. 44.12
Fig. 44.13
44.1 Daisyworld Model
421
original steady state after disturbance occurred. We have done this with
SUN LUMINOSITY ¼ IF TIME ! 120 AND TIME
180 THEN 2 ELSE 1
ð44:14Þ
and the results are shown in Figs. 44.12, 44.13, and 44.14.
How are the results changed if the optimum temperature range for the two
daisies differs? You will find for some ranges that there is hysteresis in Daisyworld,
Fig. 44.12
Fig. 44.13
44.1 Daisyworld Model
421