

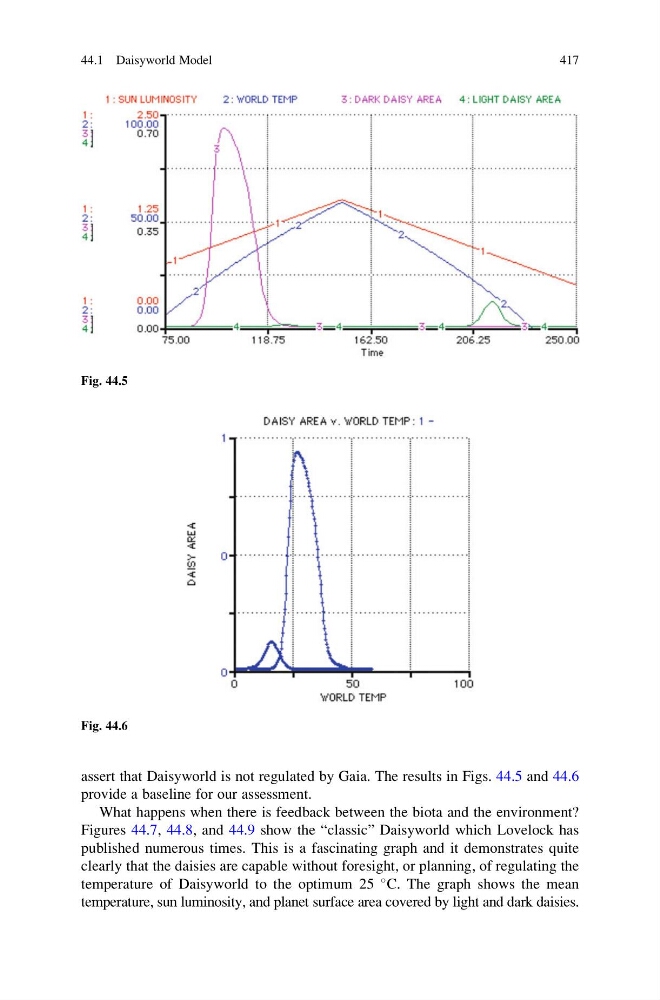
assert that Daisyworld is not regulated by Gaia. The results in Figs. 44.5 and 44.6
provide a baseline for our assessment.
What happens when there is feedback between the biota and the environment?
Figures 44.7, 44.8, and 44.9 show the “classic” Daisyworld which Lovelock has
published numerous times. This is a fascinating graph and it demonstrates quite
clearly that the daisies are capable without foresight, or planning, of regulating the
temperature of Daisyworld to the optimum 25
C. The graph shows the mean
temperature, sun luminosity, and planet surface area covered by light and dark daisies.
Fig. 44.5
Fig. 44.6
44.1 Daisyworld Model
417
provide a baseline for our assessment.
What happens when there is feedback between the biota and the environment?
Figures 44.7, 44.8, and 44.9 show the “classic” Daisyworld which Lovelock has
published numerous times. This is a fascinating graph and it demonstrates quite
clearly that the daisies are capable without foresight, or planning, of regulating the
temperature of Daisyworld to the optimum 25
C. The graph shows the mean
temperature, sun luminosity, and planet surface area covered by light and dark daisies.
Fig. 44.5
Fig. 44.6
44.1 Daisyworld Model
417