

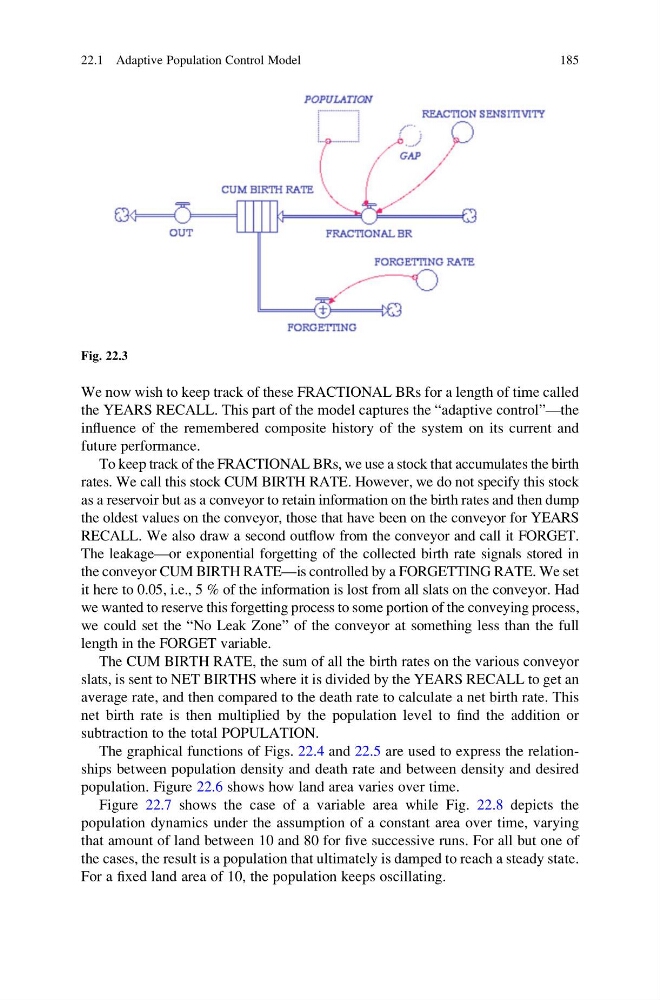
We now wish to keep track of these FRACTIONAL BRs for a length of time called
the YEARS RECALL. This part of the model captures the “adaptive control”—the
influence of the remembered composite history of the system on its current and
future performance.
To keep track of the FRACTIONAL BRs, we use a stock that accumulates the birth
rates. We call this stock CUM BIRTH RATE. However, we do not specify this stock
as a reservoir but as a conveyor to retain information on the birth rates and then dump
the oldest values on the conveyor, those that have been on the conveyor for YEARS
RECALL. We also draw a second outflow from the conveyor and call it FORGET.
The leakage—or exponential forgetting of the collected birth rate signals stored in
the conveyor CUM BIRTH RATE—is controlled by a FORGETTING RATE. We set
it here to 0.05, i.e., 5 % of the information is lost from all slats on the conveyor. Had
we wanted to reserve this forgetting process to some portion of the conveying process,
we could set the “No Leak Zone” of the conveyor at something less than the full
length in the FORGET variable.
The CUM BIRTH RATE, the sum of all the birth rates on the various conveyor
slats, is sent to NET BIRTHS where it is divided by the YEARS RECALL to get an
average rate, and then compared to the death rate to calculate a net birth rate. This
net birth rate is then multiplied by the population level to find the addition or
subtraction to the total POPULATION.
The graphical functions of Figs. 22.4 and 22.5 are used to express the relationships between population density and death rate and between density and desired
population. Figure 22.6 shows how land area varies over time.
Figure 22.7 shows the case of a variable area while Fig. 22.8 depicts the
population dynamics under the assumption of a constant area over time, varying
that amount of land between 10 and 80 for five successive runs. For all but one of
the cases, the result is a population that ultimately is damped to reach a steady state.
For a fixed land area of 10, the population keeps oscillating.
Fig. 22.3
22.1 Adaptive Population Control Model
185
the YEARS RECALL. This part of the model captures the “adaptive control”—the
influence of the remembered composite history of the system on its current and
future performance.
To keep track of the FRACTIONAL BRs, we use a stock that accumulates the birth
rates. We call this stock CUM BIRTH RATE. However, we do not specify this stock
as a reservoir but as a conveyor to retain information on the birth rates and then dump
the oldest values on the conveyor, those that have been on the conveyor for YEARS
RECALL. We also draw a second outflow from the conveyor and call it FORGET.
The leakage—or exponential forgetting of the collected birth rate signals stored in
the conveyor CUM BIRTH RATE—is controlled by a FORGETTING RATE. We set
it here to 0.05, i.e., 5 % of the information is lost from all slats on the conveyor. Had
we wanted to reserve this forgetting process to some portion of the conveying process,
we could set the “No Leak Zone” of the conveyor at something less than the full
length in the FORGET variable.
The CUM BIRTH RATE, the sum of all the birth rates on the various conveyor
slats, is sent to NET BIRTHS where it is divided by the YEARS RECALL to get an
average rate, and then compared to the death rate to calculate a net birth rate. This
net birth rate is then multiplied by the population level to find the addition or
subtraction to the total POPULATION.
The graphical functions of Figs. 22.4 and 22.5 are used to express the relationships between population density and death rate and between density and desired
population. Figure 22.6 shows how land area varies over time.
Figure 22.7 shows the case of a variable area while Fig. 22.8 depicts the
population dynamics under the assumption of a constant area over time, varying
that amount of land between 10 and 80 for five successive runs. For all but one of
the cases, the result is a population that ultimately is damped to reach a steady state.
For a fixed land area of 10, the population keeps oscillating.
Fig. 22.3
22.1 Adaptive Population Control Model
185