

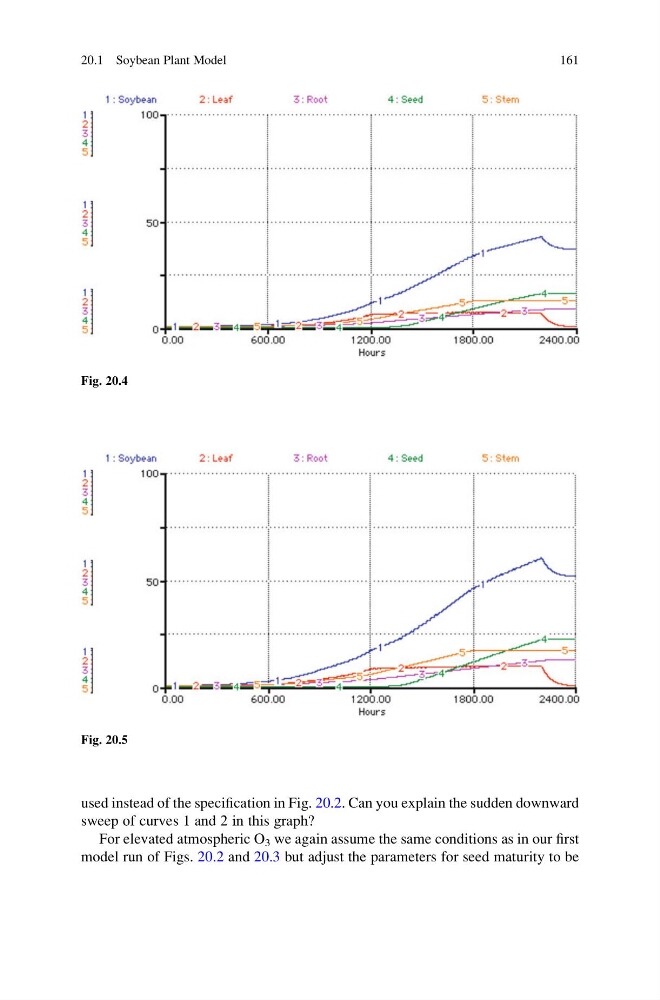
used instead of the specification in Fig. 20.2. Can you explain the sudden downward
sweep of curves 1 and 2 in this graph?
For elevated atmospheric O 3 we again assume the same conditions as in our first
model run of Figs. 20.2 and 20.3 but adjust the parameters for seed maturity to be
Fig. 20.4
Fig. 20.5
20.1 Soybean Plant Model
161
sweep of curves 1 and 2 in this graph?
For elevated atmospheric O 3 we again assume the same conditions as in our first
model run of Figs. 20.2 and 20.3 but adjust the parameters for seed maturity to be
Fig. 20.4
Fig. 20.5
20.1 Soybean Plant Model
161