

52
Jane Elith
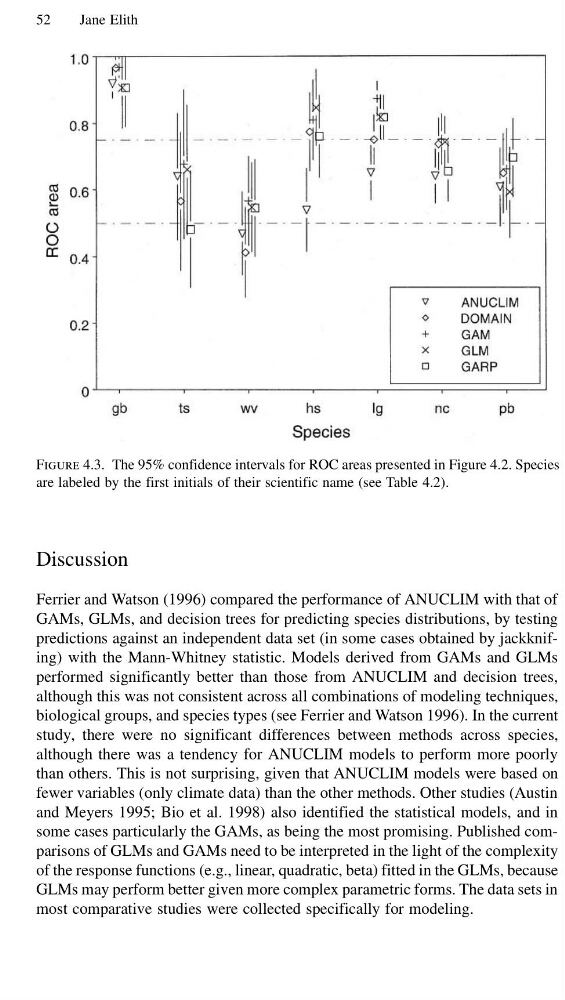
Figure 4.3. The 95% confidence intervals for ROC areas presented in Figure 4.2. Species
are labeled by the first initials of their scientific name (see Table 4.2).
Discussion
Ferrier and Watson (1996) compared the performance of ANUCLIM with that of
GAMs, GLMs, and decision trees for predicting species distributions, by testing
predictions against an independent data set (in some cases obtained by jackknifing) with the Mann-Whitney statistic. Models derived from GAMs and GLMs
performed significantly better than those from ANUCLIM and decision trees,
although this was not consistent across all combinations of modeling techniques,
biological groups, and species types (see Ferrier and Watson 1996). In the current
study, there were no significant differences between methods across species,
although there was a tendency for ANUCLIM models to perform more poorly
than others. This is not surprising, given that ANUCLIM models were based on
fewer variables (only climate data) than the other methods. Other studies (Austin
and Meyers 1995; Bio et al. 1998) also identified the statistical models, and in
some cases particularly the GAMs, as being the most promising. Published comparisons of GLMs and GAMs need to be interpreted in the light of the complexity
of the response functions (e.g., linear, quadratic, beta) fitted in the GLMs, because
GLMs may perform better given more complex parametric forms. The data sets in
most comparative studies were collected specifically for modeling.
Jane Elith
Figure 4.3. The 95% confidence intervals for ROC areas presented in Figure 4.2. Species
are labeled by the first initials of their scientific name (see Table 4.2).
Discussion
Ferrier and Watson (1996) compared the performance of ANUCLIM with that of
GAMs, GLMs, and decision trees for predicting species distributions, by testing
predictions against an independent data set (in some cases obtained by jackknifing) with the Mann-Whitney statistic. Models derived from GAMs and GLMs
performed significantly better than those from ANUCLIM and decision trees,
although this was not consistent across all combinations of modeling techniques,
biological groups, and species types (see Ferrier and Watson 1996). In the current
study, there were no significant differences between methods across species,
although there was a tendency for ANUCLIM models to perform more poorly
than others. This is not surprising, given that ANUCLIM models were based on
fewer variables (only climate data) than the other methods. Other studies (Austin
and Meyers 1995; Bio et al. 1998) also identified the statistical models, and in
some cases particularly the GAMs, as being the most promising. Published comparisons of GLMs and GAMs need to be interpreted in the light of the complexity
of the response functions (e.g., linear, quadratic, beta) fitted in the GLMs, because
GLMs may perform better given more complex parametric forms. The data sets in
most comparative studies were collected specifically for modeling.