

4. Quantitative Methods for Modeling Species Habitat
51
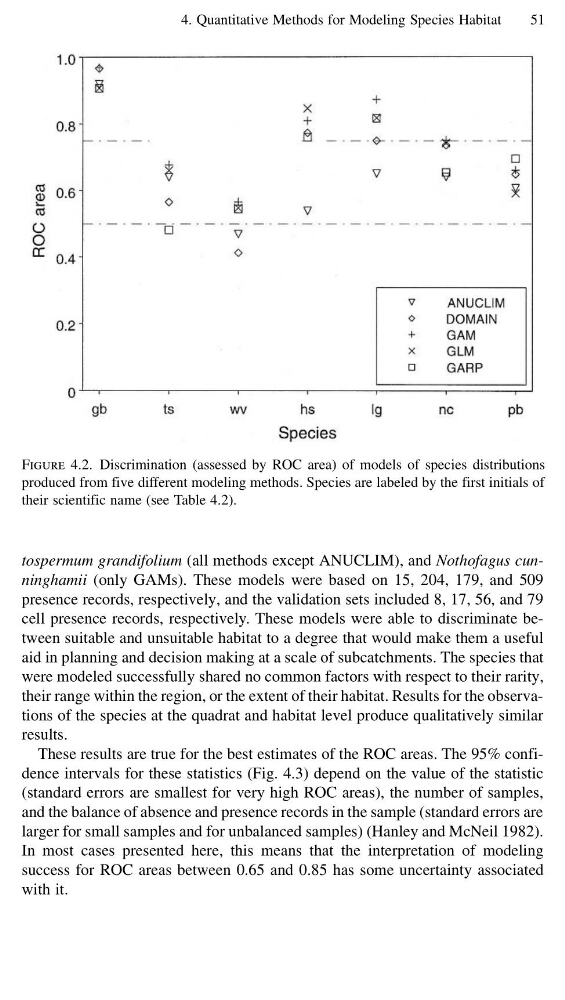
Figure 4.2. Discrimination (assessed by ROC area) of models of species distributions
produced from five different modeling methods. Species are labeled by the first initials of
their scientific name (see Table 4.2).
tospermum grandifolium (all methods except ANUCLIM), and Nothofagus cunninghamii (only GAMs). These models were based on 15, 204, 179, and 509
presence records, respectively, and the validation sets included 8, 17, 56, and 79
cell presence records, respectively. These models were able to discriminate between suitable and unsuitable habitat to a degree that would make them a useful
aid in planning and decision making at a scale of subcatchments. The species that
were modeled successfully shared no common factors with respect to their rarity,
their range within the region, or the extent of their habitat. Results for the observations of the species at the quadrat and habitat level produce qualitatively similar
results.
These results are true for the best estimates of the ROC areas. The 95% confidence intervals for these statistics (Fig. 4.3) depend on the value of the statistic
(standard errors are smallest for very high ROC areas), the number of samples,
and the balance of absence and presence records in the sample (standard errors are
larger for small samples and for unbalanced samples) (Hanley and McNeil 1982).
In most cases presented here, this means that the interpretation of modeling
success for ROC areas between 0.65 and 0.85 has some uncertainty associated
with it.
51
Figure 4.2. Discrimination (assessed by ROC area) of models of species distributions
produced from five different modeling methods. Species are labeled by the first initials of
their scientific name (see Table 4.2).
tospermum grandifolium (all methods except ANUCLIM), and Nothofagus cunninghamii (only GAMs). These models were based on 15, 204, 179, and 509
presence records, respectively, and the validation sets included 8, 17, 56, and 79
cell presence records, respectively. These models were able to discriminate between suitable and unsuitable habitat to a degree that would make them a useful
aid in planning and decision making at a scale of subcatchments. The species that
were modeled successfully shared no common factors with respect to their rarity,
their range within the region, or the extent of their habitat. Results for the observations of the species at the quadrat and habitat level produce qualitatively similar
results.
These results are true for the best estimates of the ROC areas. The 95% confidence intervals for these statistics (Fig. 4.3) depend on the value of the statistic
(standard errors are smallest for very high ROC areas), the number of samples,
and the balance of absence and presence records in the sample (standard errors are
larger for small samples and for unbalanced samples) (Hanley and McNeil 1982).
In most cases presented here, this means that the interpretation of modeling
success for ROC areas between 0.65 and 0.85 has some uncertainty associated
with it.