

36
Brendan Moyle
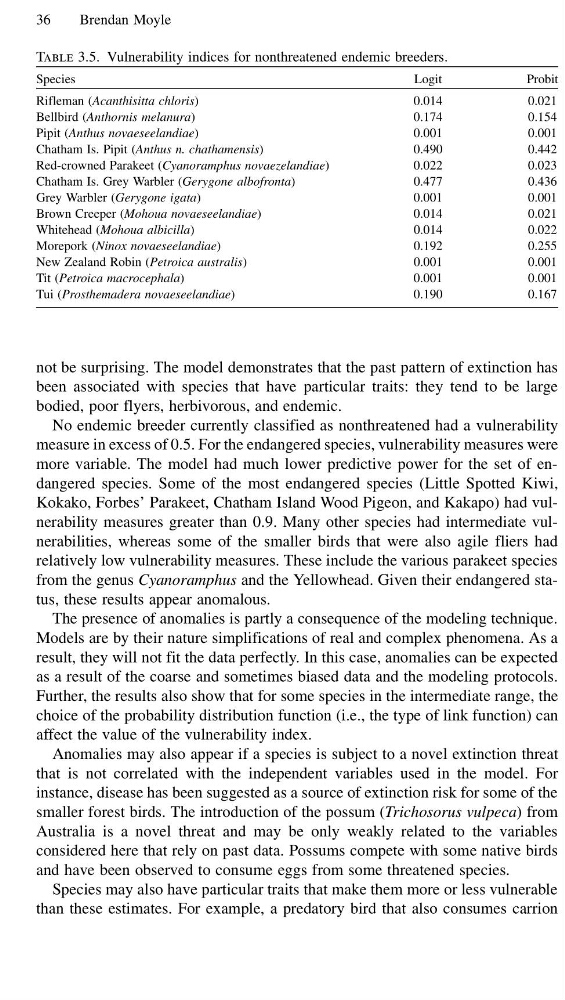
Table 3.5. Vulnerability indices for nonthreatened endemic breeders.
Species
Logit
Probit
Rifleman (Acanthisitta chloris)
0.014
0.021
Bellbird (Anthornis melanura)
0.174
0.154
Pipit (Anthus novaeseelandiae)
0.001
0.001
Chatham Is. Pipit (Anthus n. chathamensis)
0.490
0.442
Red-crowned Parakeet (Cyanoramphus novaezelandiae)
0.022
0.023
Chatham Is. Grey Warbler (Gerygone albofronta)
0.477
0.436
Grey Warbler (Gerygone igata)
0.001
0.001
Brown Creeper (Mohoua novaeseelandiae)
0.014
0.021
Whitehead (Mohoua albicilla)
0.014
0.022
Morepork (Ninox novaeseelandiae)
0.192
0.255
New Zealand Robin (Petroica australis)
0.001
0.001
Tit (Petroica macrocephala)
0.001
0.001
Tui (Prosthemadera novaeseelandiae)
0.190
0.167
not be surprising. The model demonstrates that the past pattern of extinction has
been associated with species that have particular traits: they tend to be large
bodied, poor flyers, herbivorous, and endemic.
No endemic breeder currently classified as nonthreatened had a vulnerability
measure in excess of 0.5. For the endangered species, vulnerability measures were
more variable. The model had much lower predictive power for the set of endangered species. Some of the most endangered species (Little Spotted Kiwi,
Kokako, Forbes’ Parakeet, Chatham Island Wood Pigeon, and Kakapo) had vulnerability measures greater than 0.9. Many other species had intermediate vulnerabilities, whereas some of the smaller birds that were also agile fliers had
relatively low vulnerability measures. These include the various parakeet species
from the genus Cyanoramphus and the Yellowhead. Given their endangered status, these results appear anomalous.
The presence of anomalies is partly a consequence of the modeling technique.
Models are by their nature simplifications of real and complex phenomena. As a
result, they will not fit the data perfectly. In this case, anomalies can be expected
as a result of the coarse and sometimes biased data and the modeling protocols.
Further, the results also show that for some species in the intermediate range, the
choice of the probability distribution function (i.e., the type of link function) can
affect the value of the vulnerability index.
Anomalies may also appear if a species is subject to a novel extinction threat
that is not correlated with the independent variables used in the model. For
instance, disease has been suggested as a source of extinction risk for some of the
smaller forest birds. The introduction of the possum (Trichosorus vulpeca) from
Australia is a novel threat and may be only weakly related to the variables
considered here that rely on past data. Possums compete with some native birds
and have been observed to consume eggs from some threatened species.
Species may also have particular traits that make them more or less vulnerable
than these estimates. For example, a predatory bird that also consumes carrion
Brendan Moyle
Table 3.5. Vulnerability indices for nonthreatened endemic breeders.
Species
Logit
Probit
Rifleman (Acanthisitta chloris)
0.014
0.021
Bellbird (Anthornis melanura)
0.174
0.154
Pipit (Anthus novaeseelandiae)
0.001
0.001
Chatham Is. Pipit (Anthus n. chathamensis)
0.490
0.442
Red-crowned Parakeet (Cyanoramphus novaezelandiae)
0.022
0.023
Chatham Is. Grey Warbler (Gerygone albofronta)
0.477
0.436
Grey Warbler (Gerygone igata)
0.001
0.001
Brown Creeper (Mohoua novaeseelandiae)
0.014
0.021
Whitehead (Mohoua albicilla)
0.014
0.022
Morepork (Ninox novaeseelandiae)
0.192
0.255
New Zealand Robin (Petroica australis)
0.001
0.001
Tit (Petroica macrocephala)
0.001
0.001
Tui (Prosthemadera novaeseelandiae)
0.190
0.167
not be surprising. The model demonstrates that the past pattern of extinction has
been associated with species that have particular traits: they tend to be large
bodied, poor flyers, herbivorous, and endemic.
No endemic breeder currently classified as nonthreatened had a vulnerability
measure in excess of 0.5. For the endangered species, vulnerability measures were
more variable. The model had much lower predictive power for the set of endangered species. Some of the most endangered species (Little Spotted Kiwi,
Kokako, Forbes’ Parakeet, Chatham Island Wood Pigeon, and Kakapo) had vulnerability measures greater than 0.9. Many other species had intermediate vulnerabilities, whereas some of the smaller birds that were also agile fliers had
relatively low vulnerability measures. These include the various parakeet species
from the genus Cyanoramphus and the Yellowhead. Given their endangered status, these results appear anomalous.
The presence of anomalies is partly a consequence of the modeling technique.
Models are by their nature simplifications of real and complex phenomena. As a
result, they will not fit the data perfectly. In this case, anomalies can be expected
as a result of the coarse and sometimes biased data and the modeling protocols.
Further, the results also show that for some species in the intermediate range, the
choice of the probability distribution function (i.e., the type of link function) can
affect the value of the vulnerability index.
Anomalies may also appear if a species is subject to a novel extinction threat
that is not correlated with the independent variables used in the model. For
instance, disease has been suggested as a source of extinction risk for some of the
smaller forest birds. The introduction of the possum (Trichosorus vulpeca) from
Australia is a novel threat and may be only weakly related to the variables
considered here that rely on past data. Possums compete with some native birds
and have been observed to consume eggs from some threatened species.
Species may also have particular traits that make them more or less vulnerable
than these estimates. For example, a predatory bird that also consumes carrion