

34
Brendan Moyle
nonlinear objective function, traditional measures of goodness of fit based on
linear least-squares procedures are inappropriate. Several alternative measures of
goodness of fit have been proposed and some reported here (Tables 3.1 and 3.2).
The model diagnostics suggest that the models can successfully explain about
90% of the events relating to the persistence or extinction of these 80 New
Zealand birds (prediction success is represented by a predicted probability greater
than 0.5, corresponding to an event). Such results may be expressed as falsepositive and false-negative rates, sensitivities, and specificities (see Elith, this
volume, for some more comprehensive summary techniques).
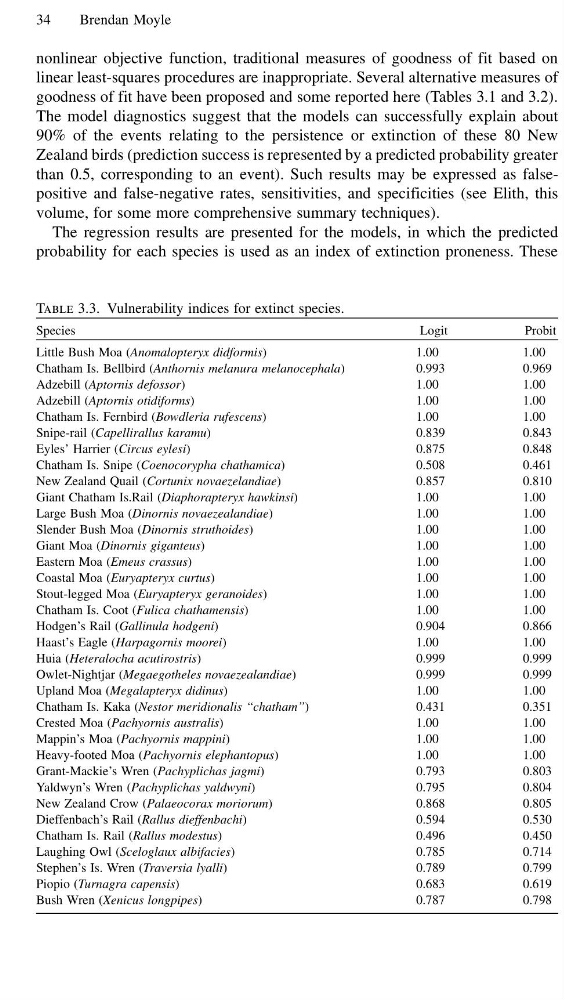
The regression results are presented for the models, in which the predicted
probability for each species is used as an index of extinction proneness. These
Table 3.3. Vulnerability indices for extinct species.
Species
Logit
Probit
Little Bush Moa (Anomalopteryx didformis)
1.00
1.00
Chatham Is. Bellbird (Anthornis melanura melanocephala)
0.993
0.969
Adzebill (Aptornis defossor)
1.00
1.00
Adzebill (Aptornis otidiforms)
1.00
1.00
Chatham Is. Fernbird (Bowdleria rufescens)
1.00
1.00
Snipe-rail (Capellirallus karamu)
0.839
0.843
Eyles’ Harrier (Circus eylesi)
0.875
0.848
Chatham Is. Snipe (Coenocorypha chathamica)
0.508
0.461
New Zealand Quail (Cortunix novaezelandiae)
0.857
0.810
Giant Chatham Is.Rail (Diaphorapteryx hawkinsi)
1.00
1.00
Large Bush Moa (Dinornis novaezealandiae)
1.00
1.00
Slender Bush Moa (Dinornis struthoides)
1.00
1.00
Giant Moa (Dinornis giganteus)
1.00
1.00
Eastern Moa (Emeus crassus)
1.00
1.00
Coastal Moa (Euryapteryx curtus)
1.00
1.00
Stout-legged Moa (Euryapteryx geranoides)
1.00
1.00
Chatham Is. Coot (Fulica chathamensis)
1.00
1.00
Hodgen’s Rail (Gallinula hodgeni)
0.904
0.866
Haast’s Eagle (Harpagornis moorei)
1.00
1.00
Huia (Heteralocha acutirostris)
0.999
0.999
Owlet-Nightjar (Megaegotheles novaezealandiae)
0.999
0.999
Upland Moa (Megalapteryx didinus)
1.00
1.00
Chatham Is. Kaka (Nestor meridionalis ‘‘chatham’’)
0.431
0.351
Crested Moa (Pachyornis australis)
1.00
1.00
Mappin’s Moa (Pachyornis mappini)
1.00
1.00
Heavy-footed Moa (Pachyornis elephantopus)
1.00
1.00
Grant-Mackie’s Wren (Pachyplichas jagmi)
0.793
0.803
Yaldwyn’s Wren (Pachyplichas yaldwyni)
0.795
0.804
New Zealand Crow (Palaeocorax moriorum)
0.868
0.805
Dieffenbach’s Rail (Rallus dieffenbachi)
0.594
0.530
Chatham Is. Rail (Rallus modestus)
0.496
0.450
Laughing Owl (Sceloglaux albifacies)
0.785
0.714
Stephen’s Is. Wren (Traversia lyalli)
0.789
0.799
Piopio (Turnagra capensis)
0.683
0.619
Bush Wren (Xenicus longpipes)
0.787
0.798
Brendan Moyle
nonlinear objective function, traditional measures of goodness of fit based on
linear least-squares procedures are inappropriate. Several alternative measures of
goodness of fit have been proposed and some reported here (Tables 3.1 and 3.2).
The model diagnostics suggest that the models can successfully explain about
90% of the events relating to the persistence or extinction of these 80 New
Zealand birds (prediction success is represented by a predicted probability greater
than 0.5, corresponding to an event). Such results may be expressed as falsepositive and false-negative rates, sensitivities, and specificities (see Elith, this
volume, for some more comprehensive summary techniques).
The regression results are presented for the models, in which the predicted
probability for each species is used as an index of extinction proneness. These
Table 3.3. Vulnerability indices for extinct species.
Species
Logit
Probit
Little Bush Moa (Anomalopteryx didformis)
1.00
1.00
Chatham Is. Bellbird (Anthornis melanura melanocephala)
0.993
0.969
Adzebill (Aptornis defossor)
1.00
1.00
Adzebill (Aptornis otidiforms)
1.00
1.00
Chatham Is. Fernbird (Bowdleria rufescens)
1.00
1.00
Snipe-rail (Capellirallus karamu)
0.839
0.843
Eyles’ Harrier (Circus eylesi)
0.875
0.848
Chatham Is. Snipe (Coenocorypha chathamica)
0.508
0.461
New Zealand Quail (Cortunix novaezelandiae)
0.857
0.810
Giant Chatham Is.Rail (Diaphorapteryx hawkinsi)
1.00
1.00
Large Bush Moa (Dinornis novaezealandiae)
1.00
1.00
Slender Bush Moa (Dinornis struthoides)
1.00
1.00
Giant Moa (Dinornis giganteus)
1.00
1.00
Eastern Moa (Emeus crassus)
1.00
1.00
Coastal Moa (Euryapteryx curtus)
1.00
1.00
Stout-legged Moa (Euryapteryx geranoides)
1.00
1.00
Chatham Is. Coot (Fulica chathamensis)
1.00
1.00
Hodgen’s Rail (Gallinula hodgeni)
0.904
0.866
Haast’s Eagle (Harpagornis moorei)
1.00
1.00
Huia (Heteralocha acutirostris)
0.999
0.999
Owlet-Nightjar (Megaegotheles novaezealandiae)
0.999
0.999
Upland Moa (Megalapteryx didinus)
1.00
1.00
Chatham Is. Kaka (Nestor meridionalis ‘‘chatham’’)
0.431
0.351
Crested Moa (Pachyornis australis)
1.00
1.00
Mappin’s Moa (Pachyornis mappini)
1.00
1.00
Heavy-footed Moa (Pachyornis elephantopus)
1.00
1.00
Grant-Mackie’s Wren (Pachyplichas jagmi)
0.793
0.803
Yaldwyn’s Wren (Pachyplichas yaldwyni)
0.795
0.804
New Zealand Crow (Palaeocorax moriorum)
0.868
0.805
Dieffenbach’s Rail (Rallus dieffenbachi)
0.594
0.530
Chatham Is. Rail (Rallus modestus)
0.496
0.450
Laughing Owl (Sceloglaux albifacies)
0.785
0.714
Stephen’s Is. Wren (Traversia lyalli)
0.789
0.799
Piopio (Turnagra capensis)
0.683
0.619
Bush Wren (Xenicus longpipes)
0.787
0.798