

302
Hugh Possingham, Ian Ball, and Sandy Andelman
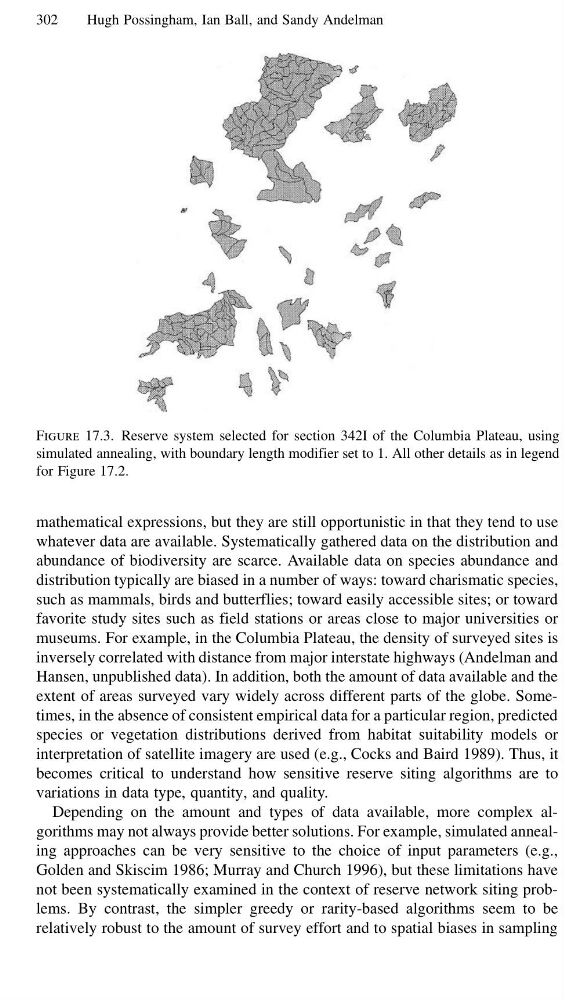
Figure 17.3. Reserve system selected for section 342I of the Columbia Plateau, using
simulated annealing, with boundary length modifier set to 1. All other details as in legend
for Figure 17.2.
mathematical expressions, but they are still opportunistic in that they tend to use
whatever data are available. Systematically gathered data on the distribution and
abundance of biodiversity are scarce. Available data on species abundance and
distribution typically are biased in a number of ways: toward charismatic species,
such as mammals, birds and butterflies; toward easily accessible sites; or toward
favorite study sites such as field stations or areas close to major universities or
museums. For example, in the Columbia Plateau, the density of surveyed sites is
inversely correlated with distance from major interstate highways (Andelman and
Hansen, unpublished data). In addition, both the amount of data available and the
extent of areas surveyed vary widely across different parts of the globe. Sometimes, in the absence of consistent empirical data for a particular region, predicted
species or vegetation distributions derived from habitat suitability models or
interpretation of satellite imagery are used (e.g., Cocks and Baird 1989). Thus, it
becomes critical to understand how sensitive reserve siting algorithms are to
variations in data type, quantity, and quality.
Depending on the amount and types of data available, more complex algorithms may not always provide better solutions. For example, simulated annealing approaches can be very sensitive to the choice of input parameters (e.g.,
Golden and Skiscim 1986; Murray and Church 1996), but these limitations have
not been systematically examined in the context of reserve network siting problems. By contrast, the simpler greedy or rarity-based algorithms seem to be
relatively robust to the amount of survey effort and to spatial biases in sampling
Hugh Possingham, Ian Ball, and Sandy Andelman
Figure 17.3. Reserve system selected for section 342I of the Columbia Plateau, using
simulated annealing, with boundary length modifier set to 1. All other details as in legend
for Figure 17.2.
mathematical expressions, but they are still opportunistic in that they tend to use
whatever data are available. Systematically gathered data on the distribution and
abundance of biodiversity are scarce. Available data on species abundance and
distribution typically are biased in a number of ways: toward charismatic species,
such as mammals, birds and butterflies; toward easily accessible sites; or toward
favorite study sites such as field stations or areas close to major universities or
museums. For example, in the Columbia Plateau, the density of surveyed sites is
inversely correlated with distance from major interstate highways (Andelman and
Hansen, unpublished data). In addition, both the amount of data available and the
extent of areas surveyed vary widely across different parts of the globe. Sometimes, in the absence of consistent empirical data for a particular region, predicted
species or vegetation distributions derived from habitat suitability models or
interpretation of satellite imagery are used (e.g., Cocks and Baird 1989). Thus, it
becomes critical to understand how sensitive reserve siting algorithms are to
variations in data type, quantity, and quality.
Depending on the amount and types of data available, more complex algorithms may not always provide better solutions. For example, simulated annealing approaches can be very sensitive to the choice of input parameters (e.g.,
Golden and Skiscim 1986; Murray and Church 1996), but these limitations have
not been systematically examined in the context of reserve network siting problems. By contrast, the simpler greedy or rarity-based algorithms seem to be
relatively robust to the amount of survey effort and to spatial biases in sampling