

16. Theoretical Properties of Extinction by Inbreeding Depression
283
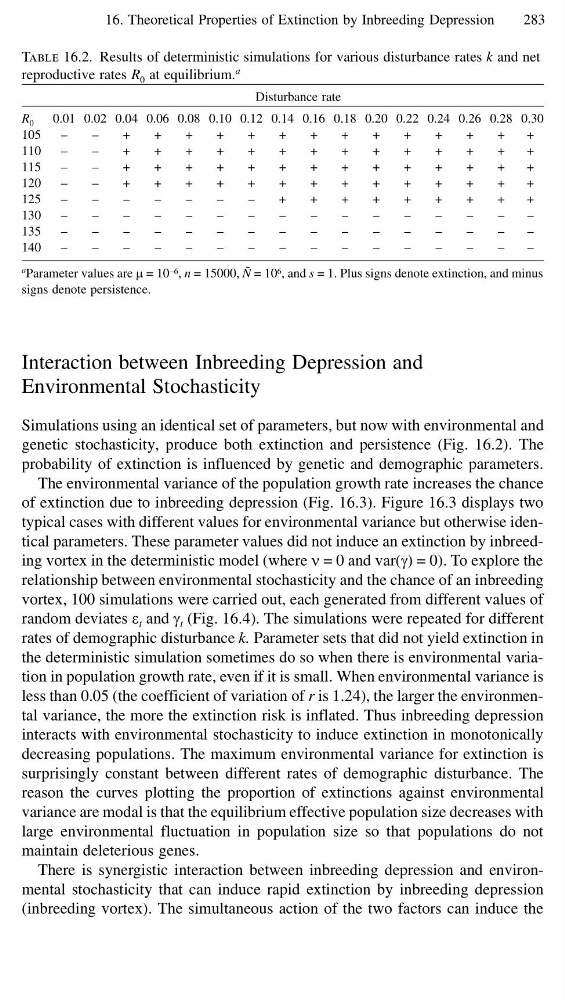
Table 16.2. Results of deterministic simulations for various disturbance rates k and net
reproductive rates R 0 at equilibrium.
a
Disturbance rate
R 0 0.01 0.02 0.04 0.06 0.08 0.10 0.12 0.14 0.16 0.18 0.20 0.22 0.24 0.26 0.28 0.30
105
–
–
+
+
+
+
+
+
+
+
+
+
+
+
+
+
110
–
–
+
+
+
+
+
+
+
+
+
+
+
+
+
+
115
–
–
+
+
+
+
+
+
+
+
+
+
+
+
+
+
120
–
–
+
+
+
+
+
+
+
+
+
+
+
+
+
+
125
–
–
–
–
–
–
–
+
+
+
+
+
+
+
+
+
130
–
–
–
–
–
–
–
–
–
–
–
–
–
–
–
–
135
–
–
–
–
–
–
–
–
–
–
–
–
–
–
–
–
140
–
–
–
–
–
–
–
–
–
–
–
–
–
–
–
–
a Parameter values are µ = 10 −6 , n = 15000, ˜
N = 10 6 , and s = 1. Plus signs denote extinction, and minus
signs denote persistence.
Interaction between Inbreeding Depression and
Environmental Stochasticity
Simulations using an identical set of parameters, but now with environmental and
genetic stochasticity, produce both extinction and persistence (Fig. 16.2). The
probability of extinction is influenced by genetic and demographic parameters.
The environmental variance of the population growth rate increases the chance
of extinction due to inbreeding depression (Fig. 16.3). Figure 16.3 displays two
typical cases with different values for environmental variance but otherwise identical parameters. These parameter values did not induce an extinction by inbreeding vortex in the deterministic model (where ν = 0 and var(γ) = 0). To explore the
relationship between environmental stochasticity and the chance of an inbreeding
vortex, 100 simulations were carried out, each generated from different values of
random deviates ε t and γ t (Fig. 16.4). The simulations were repeated for different
rates of demographic disturbance k. Parameter sets that did not yield extinction in
the deterministic simulation sometimes do so when there is environmental variation in population growth rate, even if it is small. When environmental variance is
less than 0.05 (the coefficient of variation of r is 1.24), the larger the environmental variance, the more the extinction risk is inflated. Thus inbreeding depression
interacts with environmental stochasticity to induce extinction in monotonically
decreasing populations. The maximum environmental variance for extinction is
surprisingly constant between different rates of demographic disturbance. The
reason the curves plotting the proportion of extinctions against environmental
variance are modal is that the equilibrium effective population size decreases with
large environmental fluctuation in population size so that populations do not
maintain deleterious genes.
There is synergistic interaction between inbreeding depression and environmental stochasticity that can induce rapid extinction by inbreeding depression
(inbreeding vortex). The simultaneous action of the two factors can induce the
283
Table 16.2. Results of deterministic simulations for various disturbance rates k and net
reproductive rates R 0 at equilibrium.
a
Disturbance rate
R 0 0.01 0.02 0.04 0.06 0.08 0.10 0.12 0.14 0.16 0.18 0.20 0.22 0.24 0.26 0.28 0.30
105
–
–
+
+
+
+
+
+
+
+
+
+
+
+
+
+
110
–
–
+
+
+
+
+
+
+
+
+
+
+
+
+
+
115
–
–
+
+
+
+
+
+
+
+
+
+
+
+
+
+
120
–
–
+
+
+
+
+
+
+
+
+
+
+
+
+
+
125
–
–
–
–
–
–
–
+
+
+
+
+
+
+
+
+
130
–
–
–
–
–
–
–
–
–
–
–
–
–
–
–
–
135
–
–
–
–
–
–
–
–
–
–
–
–
–
–
–
–
140
–
–
–
–
–
–
–
–
–
–
–
–
–
–
–
–
a Parameter values are µ = 10 −6 , n = 15000, ˜
N = 10 6 , and s = 1. Plus signs denote extinction, and minus
signs denote persistence.
Interaction between Inbreeding Depression and
Environmental Stochasticity
Simulations using an identical set of parameters, but now with environmental and
genetic stochasticity, produce both extinction and persistence (Fig. 16.2). The
probability of extinction is influenced by genetic and demographic parameters.
The environmental variance of the population growth rate increases the chance
of extinction due to inbreeding depression (Fig. 16.3). Figure 16.3 displays two
typical cases with different values for environmental variance but otherwise identical parameters. These parameter values did not induce an extinction by inbreeding vortex in the deterministic model (where ν = 0 and var(γ) = 0). To explore the
relationship between environmental stochasticity and the chance of an inbreeding
vortex, 100 simulations were carried out, each generated from different values of
random deviates ε t and γ t (Fig. 16.4). The simulations were repeated for different
rates of demographic disturbance k. Parameter sets that did not yield extinction in
the deterministic simulation sometimes do so when there is environmental variation in population growth rate, even if it is small. When environmental variance is
less than 0.05 (the coefficient of variation of r is 1.24), the larger the environmental variance, the more the extinction risk is inflated. Thus inbreeding depression
interacts with environmental stochasticity to induce extinction in monotonically
decreasing populations. The maximum environmental variance for extinction is
surprisingly constant between different rates of demographic disturbance. The
reason the curves plotting the proportion of extinctions against environmental
variance are modal is that the equilibrium effective population size decreases with
large environmental fluctuation in population size so that populations do not
maintain deleterious genes.
There is synergistic interaction between inbreeding depression and environmental stochasticity that can induce rapid extinction by inbreeding depression
(inbreeding vortex). The simultaneous action of the two factors can induce the