

282
Yoshinari Tanaka
k = 0.04 and 0.1) even if other parameter values were unaltered. The discrepancy
is a result of differences in the efficiency of the purging selection against the deleterious genes. With slower rates of population decline, the purging selection
continued to act long enough to exclude the deleterious genes. With higher rates of
demographic disturbances, however, the positive feedback between inbreeding
depression and the declining population size exceeded the capacity of purging
selection, leading to an extinction vortex. The sharp decrease in population size
immediately preceding extinction and the concomitant rapid increase in the inbreeding coefficient are consistent with an extinction vortex (Fig. 16.1).
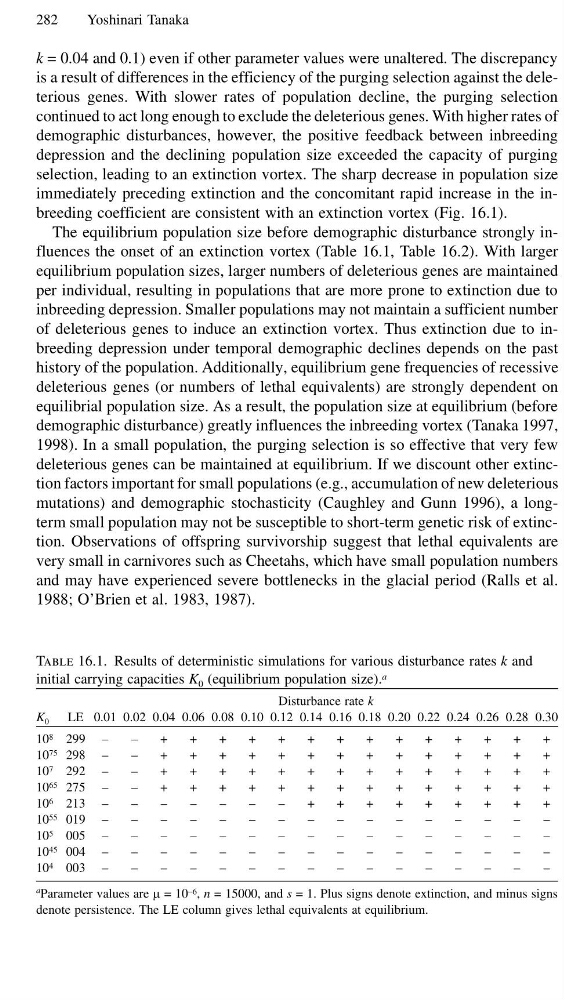
The equilibrium population size before demographic disturbance strongly influences the onset of an extinction vortex (Table 16.1, Table 16.2). With larger
equilibrium population sizes, larger numbers of deleterious genes are maintained
per individual, resulting in populations that are more prone to extinction due to
inbreeding depression. Smaller populations may not maintain a sufficient number
of deleterious genes to induce an extinction vortex. Thus extinction due to inbreeding depression under temporal demographic declines depends on the past
history of the population. Additionally, equilibrium gene frequencies of recessive
deleterious genes (or numbers of lethal equivalents) are strongly dependent on
equilibrial population size. As a result, the population size at equilibrium (before
demographic disturbance) greatly influences the inbreeding vortex (Tanaka 1997,
1998). In a small population, the purging selection is so effective that very few
deleterious genes can be maintained at equilibrium. If we discount other extinction factors important for small populations (e.g., accumulation of new deleterious
mutations) and demographic stochasticity (Caughley and Gunn 1996), a longterm small population may not be susceptible to short-term genetic risk of extinction. Observations of offspring survivorship suggest that lethal equivalents are
very small in carnivores such as Cheetahs, which have small population numbers
and may have experienced severe bottlenecks in the glacial period (Ralls et al.
1988; O’Brien et al. 1983, 1987).
Table 16.1. Results of deterministic simulations for various disturbance rates k and
initial carrying capacities K 0 (equilibrium population size). a
Disturbance rate k
K 0 LE 0.01 0.02 0.04 0.06 0.08 0.10 0.12 0.14 0.16 0.18 0.20 0.22 0.24 0.26 0.28 0.30
10 8 299 –
–
+
+
+
+
+
+
+
+
+
+
+
+
+
+
10 75 298 –
–
+
+
+
+
+
+
+
+
+
+
+
+
+
+
10 7 292 –
–
+
+
+
+
+
+
+
+
+
+
+
+
+
+
10 65 275 –
–
+
+
+
+
+
+
+
+
+
+
+
+
+
+
10 6 213 –
–
–
–
–
–
–
+
+
+
+
+
+
+
+
+
10 55 019 –
–
–
–
–
–
–
–
–
–
–
–
–
–
–
–
10 5 005 –
–
–
–
–
–
–
–
–
–
–
–
–
–
–
–
10 45 004 –
–
–
–
–
–
–
–
–
–
–
–
–
–
–
–
10 4 003 –
–
–
–
–
–
–
–
–
–
–
–
–
–
–
–
a
Parameter values are µ = 10 −6 , n = 15000, and s = 1. Plus signs denote extinction, and minus signs
denote persistence. The LE column gives lethal equivalents at equilibrium.
Yoshinari Tanaka
k = 0.04 and 0.1) even if other parameter values were unaltered. The discrepancy
is a result of differences in the efficiency of the purging selection against the deleterious genes. With slower rates of population decline, the purging selection
continued to act long enough to exclude the deleterious genes. With higher rates of
demographic disturbances, however, the positive feedback between inbreeding
depression and the declining population size exceeded the capacity of purging
selection, leading to an extinction vortex. The sharp decrease in population size
immediately preceding extinction and the concomitant rapid increase in the inbreeding coefficient are consistent with an extinction vortex (Fig. 16.1).
The equilibrium population size before demographic disturbance strongly influences the onset of an extinction vortex (Table 16.1, Table 16.2). With larger
equilibrium population sizes, larger numbers of deleterious genes are maintained
per individual, resulting in populations that are more prone to extinction due to
inbreeding depression. Smaller populations may not maintain a sufficient number
of deleterious genes to induce an extinction vortex. Thus extinction due to inbreeding depression under temporal demographic declines depends on the past
history of the population. Additionally, equilibrium gene frequencies of recessive
deleterious genes (or numbers of lethal equivalents) are strongly dependent on
equilibrial population size. As a result, the population size at equilibrium (before
demographic disturbance) greatly influences the inbreeding vortex (Tanaka 1997,
1998). In a small population, the purging selection is so effective that very few
deleterious genes can be maintained at equilibrium. If we discount other extinction factors important for small populations (e.g., accumulation of new deleterious
mutations) and demographic stochasticity (Caughley and Gunn 1996), a longterm small population may not be susceptible to short-term genetic risk of extinction. Observations of offspring survivorship suggest that lethal equivalents are
very small in carnivores such as Cheetahs, which have small population numbers
and may have experienced severe bottlenecks in the glacial period (Ralls et al.
1988; O’Brien et al. 1983, 1987).
Table 16.1. Results of deterministic simulations for various disturbance rates k and
initial carrying capacities K 0 (equilibrium population size). a
Disturbance rate k
K 0 LE 0.01 0.02 0.04 0.06 0.08 0.10 0.12 0.14 0.16 0.18 0.20 0.22 0.24 0.26 0.28 0.30
10 8 299 –
–
+
+
+
+
+
+
+
+
+
+
+
+
+
+
10 75 298 –
–
+
+
+
+
+
+
+
+
+
+
+
+
+
+
10 7 292 –
–
+
+
+
+
+
+
+
+
+
+
+
+
+
+
10 65 275 –
–
+
+
+
+
+
+
+
+
+
+
+
+
+
+
10 6 213 –
–
–
–
–
–
–
+
+
+
+
+
+
+
+
+
10 55 019 –
–
–
–
–
–
–
–
–
–
–
–
–
–
–
–
10 5 005 –
–
–
–
–
–
–
–
–
–
–
–
–
–
–
–
10 45 004 –
–
–
–
–
–
–
–
–
–
–
–
–
–
–
–
10 4 003 –
–
–
–
–
–
–
–
–
–
–
–
–
–
–
–
a
Parameter values are µ = 10 −6 , n = 15000, and s = 1. Plus signs denote extinction, and minus signs
denote persistence. The LE column gives lethal equivalents at equilibrium.