

2. Inferring Threat from Scientific Collections
15
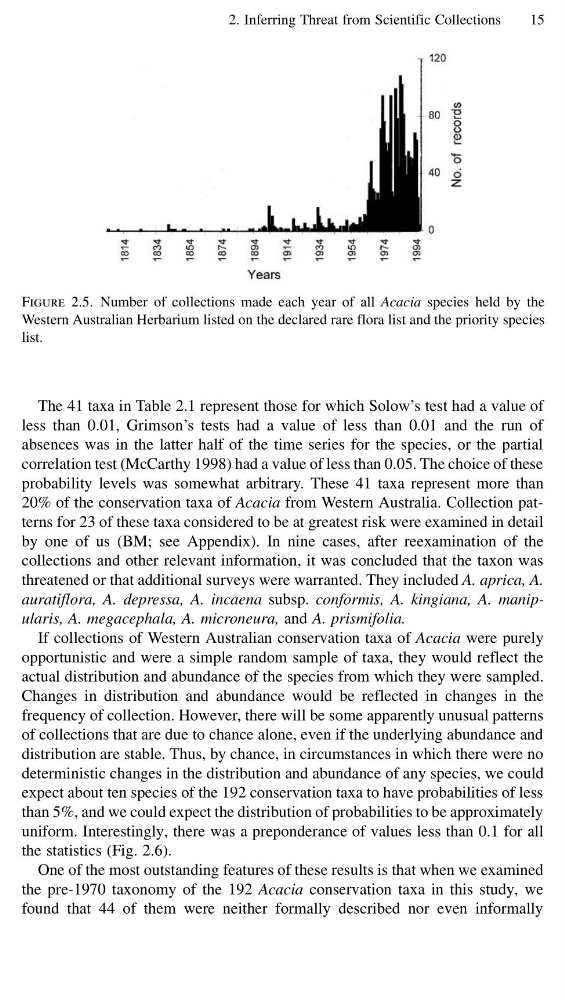
Figure 2.5. Number of collections made each year of all Acacia species held by the
Western Australian Herbarium listed on the declared rare flora list and the priority species
list.
The 41 taxa in Table 2.1 represent those for which Solow’s test had a value of
less than 0.01, Grimson’s tests had a value of less than 0.01 and the run of
absences was in the latter half of the time series for the species, or the partial
correlation test (McCarthy 1998) had a value of less than 0.05. The choice of these
probability levels was somewhat arbitrary. These 41 taxa represent more than
20% of the conservation taxa of Acacia from Western Australia. Collection patterns for 23 of these taxa considered to be at greatest risk were examined in detail
by one of us (BM; see Appendix). In nine cases, after reexamination of the
collections and other relevant information, it was concluded that the taxon was
threatened or that additional surveys were warranted. They included A. aprica, A.
auratiflora, A. depressa, A. incaena subsp. conformis, A. kingiana, A. manipularis, A. megacephala, A. microneura, and A. prismifolia.
If collections of Western Australian conservation taxa of Acacia were purely
opportunistic and were a simple random sample of taxa, they would reflect the
actual distribution and abundance of the species from which they were sampled.
Changes in distribution and abundance would be reflected in changes in the
frequency of collection. However, there will be some apparently unusual patterns
of collections that are due to chance alone, even if the underlying abundance and
distribution are stable. Thus, by chance, in circumstances in which there were no
deterministic changes in the distribution and abundance of any species, we could
expect about ten species of the 192 conservation taxa to have probabilities of less
than 5%, and we could expect the distribution of probabilities to be approximately
uniform. Interestingly, there was a preponderance of values less than 0.1 for all
the statistics (Fig. 2.6).
One of the most outstanding features of these results is that when we examined
the pre-1970 taxonomy of the 192 Acacia conservation taxa in this study, we
found that 44 of them were neither formally described nor even informally
15
Figure 2.5. Number of collections made each year of all Acacia species held by the
Western Australian Herbarium listed on the declared rare flora list and the priority species
list.
The 41 taxa in Table 2.1 represent those for which Solow’s test had a value of
less than 0.01, Grimson’s tests had a value of less than 0.01 and the run of
absences was in the latter half of the time series for the species, or the partial
correlation test (McCarthy 1998) had a value of less than 0.05. The choice of these
probability levels was somewhat arbitrary. These 41 taxa represent more than
20% of the conservation taxa of Acacia from Western Australia. Collection patterns for 23 of these taxa considered to be at greatest risk were examined in detail
by one of us (BM; see Appendix). In nine cases, after reexamination of the
collections and other relevant information, it was concluded that the taxon was
threatened or that additional surveys were warranted. They included A. aprica, A.
auratiflora, A. depressa, A. incaena subsp. conformis, A. kingiana, A. manipularis, A. megacephala, A. microneura, and A. prismifolia.
If collections of Western Australian conservation taxa of Acacia were purely
opportunistic and were a simple random sample of taxa, they would reflect the
actual distribution and abundance of the species from which they were sampled.
Changes in distribution and abundance would be reflected in changes in the
frequency of collection. However, there will be some apparently unusual patterns
of collections that are due to chance alone, even if the underlying abundance and
distribution are stable. Thus, by chance, in circumstances in which there were no
deterministic changes in the distribution and abundance of any species, we could
expect about ten species of the 192 conservation taxa to have probabilities of less
than 5%, and we could expect the distribution of probabilities to be approximately
uniform. Interestingly, there was a preponderance of values less than 0.1 for all
the statistics (Fig. 2.6).
One of the most outstanding features of these results is that when we examined
the pre-1970 taxonomy of the 192 Acacia conservation taxa in this study, we
found that 44 of them were neither formally described nor even informally