

14
Mark Burgman et al.
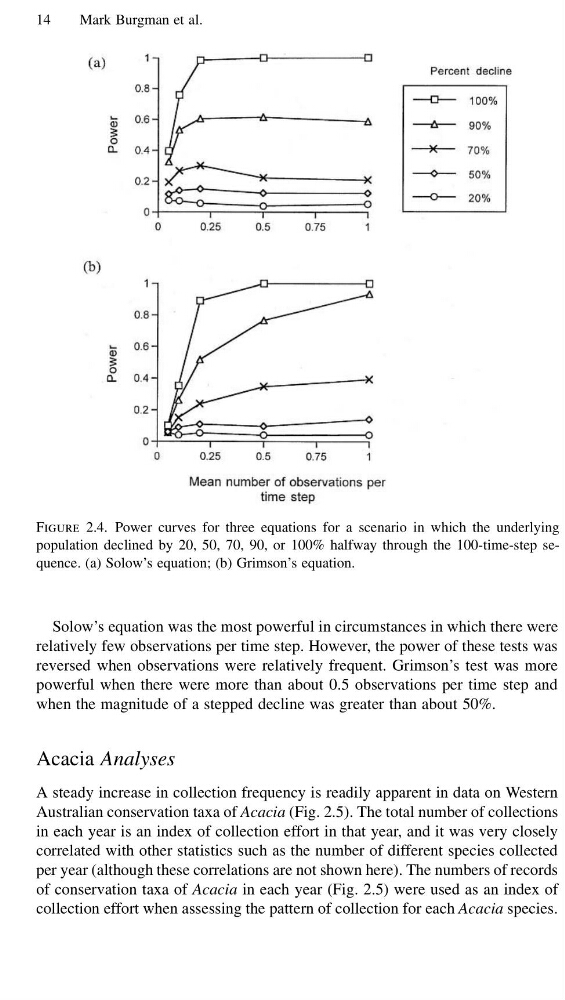
Figure 2.4. Power curves for three equations for a scenario in which the underlying
population declined by 20, 50, 70, 90, or 100% halfway through the 100-time-step sequence. (a) Solow’s equation; (b) Grimson’s equation.
Solow’s equation was the most powerful in circumstances in which there were
relatively few observations per time step. However, the power of these tests was
reversed when observations were relatively frequent. Grimson’s test was more
powerful when there were more than about 0.5 observations per time step and
when the magnitude of a stepped decline was greater than about 50%.
Acacia Analyses
A steady increase in collection frequency is readily apparent in data on Western
Australian conservation taxa of Acacia (Fig. 2.5). The total number of collections
in each year is an index of collection effort in that year, and it was very closely
correlated with other statistics such as the number of different species collected
per year (although these correlations are not shown here). The numbers of records
of conservation taxa of Acacia in each year (Fig. 2.5) were used as an index of
collection effort when assessing the pattern of collection for each Acacia species.
Mark Burgman et al.
Figure 2.4. Power curves for three equations for a scenario in which the underlying
population declined by 20, 50, 70, 90, or 100% halfway through the 100-time-step sequence. (a) Solow’s equation; (b) Grimson’s equation.
Solow’s equation was the most powerful in circumstances in which there were
relatively few observations per time step. However, the power of these tests was
reversed when observations were relatively frequent. Grimson’s test was more
powerful when there were more than about 0.5 observations per time step and
when the magnitude of a stepped decline was greater than about 50%.
Acacia Analyses
A steady increase in collection frequency is readily apparent in data on Western
Australian conservation taxa of Acacia (Fig. 2.5). The total number of collections
in each year is an index of collection effort in that year, and it was very closely
correlated with other statistics such as the number of different species collected
per year (although these correlations are not shown here). The numbers of records
of conservation taxa of Acacia in each year (Fig. 2.5) were used as an index of
collection effort when assessing the pattern of collection for each Acacia species.