

156
Selina S. Heppell, Deborah T. Crouse, and Larry B. Crowder
Loggerhead case study). Such trajectories are not exact but can be used to estimate
how quickly a population could recover if vital rates remain fairly constant. In the
Loggerhead Sea Turtle model, we produced a response surface to estimate the
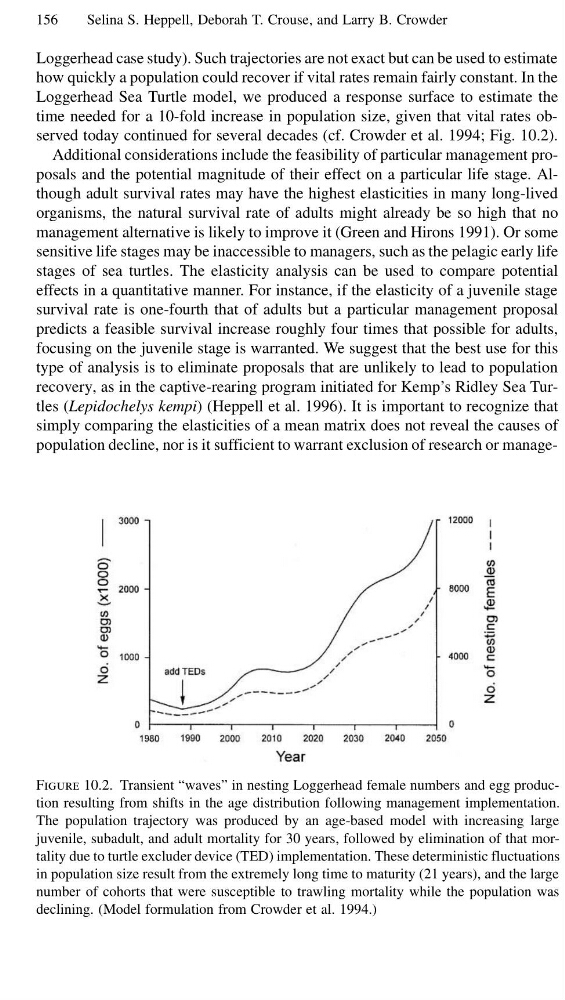
time needed for a 10-fold increase in population size, given that vital rates observed today continued for several decades (cf. Crowder et al. 1994; Fig. 10.2).
Additional considerations include the feasibility of particular management proposals and the potential magnitude of their effect on a particular life stage. Although adult survival rates may have the highest elasticities in many long-lived
organisms, the natural survival rate of adults might already be so high that no
management alternative is likely to improve it (Green and Hirons 1991). Or some
sensitive life stages may be inaccessible to managers, such as the pelagic early life
stages of sea turtles. The elasticity analysis can be used to compare potential
effects in a quantitative manner. For instance, if the elasticity of a juvenile stage
survival rate is one-fourth that of adults but a particular management proposal
predicts a feasible survival increase roughly four times that possible for adults,
focusing on the juvenile stage is warranted. We suggest that the best use for this
type of analysis is to eliminate proposals that are unlikely to lead to population
recovery, as in the captive-rearing program initiated for Kemp’s Ridley Sea Turtles (Lepidochelys kempi) (Heppell et al. 1996). It is important to recognize that
simply comparing the elasticities of a mean matrix does not reveal the causes of
population decline, nor is it sufficient to warrant exclusion of research or manageFigure 10.2. Transient “waves” in nesting Loggerhead female numbers and egg production resulting from shifts in the age distribution following management implementation.
The population trajectory was produced by an age-based model with increasing large
juvenile, subadult, and adult mortality for 30 years, followed by elimination of that mortality due to turtle excluder device (TED) implementation. These deterministic fluctuations
in population size result from the extremely long time to maturity (21 years), and the large
number of cohorts that were susceptible to trawling mortality while the population was
declining. (Model formulation from Crowder et al. 1994.)
Selina S. Heppell, Deborah T. Crouse, and Larry B. Crowder
Loggerhead case study). Such trajectories are not exact but can be used to estimate
how quickly a population could recover if vital rates remain fairly constant. In the
Loggerhead Sea Turtle model, we produced a response surface to estimate the
time needed for a 10-fold increase in population size, given that vital rates observed today continued for several decades (cf. Crowder et al. 1994; Fig. 10.2).
Additional considerations include the feasibility of particular management proposals and the potential magnitude of their effect on a particular life stage. Although adult survival rates may have the highest elasticities in many long-lived
organisms, the natural survival rate of adults might already be so high that no
management alternative is likely to improve it (Green and Hirons 1991). Or some
sensitive life stages may be inaccessible to managers, such as the pelagic early life
stages of sea turtles. The elasticity analysis can be used to compare potential
effects in a quantitative manner. For instance, if the elasticity of a juvenile stage
survival rate is one-fourth that of adults but a particular management proposal
predicts a feasible survival increase roughly four times that possible for adults,
focusing on the juvenile stage is warranted. We suggest that the best use for this
type of analysis is to eliminate proposals that are unlikely to lead to population
recovery, as in the captive-rearing program initiated for Kemp’s Ridley Sea Turtles (Lepidochelys kempi) (Heppell et al. 1996). It is important to recognize that
simply comparing the elasticities of a mean matrix does not reveal the causes of
population decline, nor is it sufficient to warrant exclusion of research or manageFigure 10.2. Transient “waves” in nesting Loggerhead female numbers and egg production resulting from shifts in the age distribution following management implementation.
The population trajectory was produced by an age-based model with increasing large
juvenile, subadult, and adult mortality for 30 years, followed by elimination of that mortality due to turtle excluder device (TED) implementation. These deterministic fluctuations
in population size result from the extremely long time to maturity (21 years), and the large
number of cohorts that were susceptible to trawling mortality while the population was
declining. (Model formulation from Crowder et al. 1994.)