

10. Using Matrix Models to Focus Research and Management Efforts
155
A i,j
λ
∂λ
∂A i,j
=
∂ logλ
∂ logA i,j
=
A i,j
λ
v i w i
〈v | w〉
(10.8)
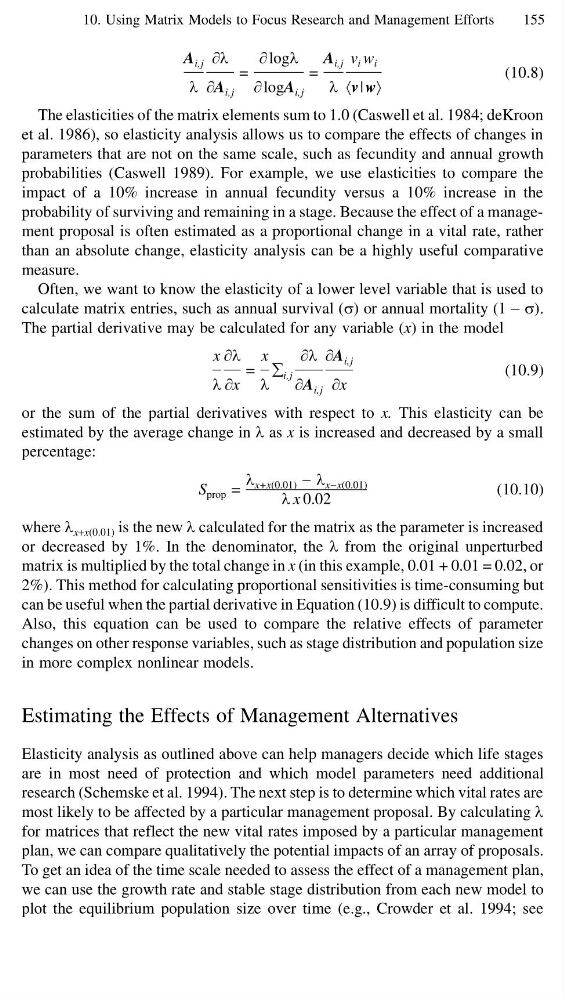
The elasticities of the matrix elements sum to 1.0 (Caswell et al. 1984; deKroon
et al. 1986), so elasticity analysis allows us to compare the effects of changes in
parameters that are not on the same scale, such as fecundity and annual growth
probabilities (Caswell 1989). For example, we use elasticities to compare the
impact of a 10% increase in annual fecundity versus a 10% increase in the
probability of surviving and remaining in a stage. Because the effect of a management proposal is often estimated as a proportional change in a vital rate, rather
than an absolute change, elasticity analysis can be a highly useful comparative
measure.
Often, we want to know the elasticity of a lower level variable that is used to
calculate matrix entries, such as annual survival (σ) or annual mortality (1 − σ).
The partial derivative may be calculated for any variable (x) in the model
x
λ
∂λ
∂x
=
x
λ
∑ i,j
∂λ
∂A i,j
∂A i,j
∂x
(10.9)
or the sum of the partial derivatives with respect to x. This elasticity can be
estimated by the average change in λ as x is increased and decreased by a small
percentage:
S prop =
λ x+x(0.01) − λ x−x(0.01)
λ x 0.02
(10.10)
where λ x+x(0.01) is the new λ calculated for the matrix as the parameter is increased
or decreased by 1%. In the denominator, the λ from the original unperturbed
matrix is multiplied by the total change in x (in this example, 0.01 + 0.01 = 0.02, or
2%). This method for calculating proportional sensitivities is time-consuming but
can be useful when the partial derivative in Equation (10.9) is difficult to compute.
Also, this equation can be used to compare the relative effects of parameter
changes on other response variables, such as stage distribution and population size
in more complex nonlinear models.
Estimating the Effects of Management Alternatives
Elasticity analysis as outlined above can help managers decide which life stages
are in most need of protection and which model parameters need additional
research (Schemske et al. 1994). The next step is to determine which vital rates are
most likely to be affected by a particular management proposal. By calculating λ
for matrices that reflect the new vital rates imposed by a particular management
plan, we can compare qualitatively the potential impacts of an array of proposals.
To get an idea of the time scale needed to assess the effect of a management plan,
we can use the growth rate and stable stage distribution from each new model to
plot the equilibrium population size over time (e.g., Crowder et al. 1994; see
155
A i,j
λ
∂λ
∂A i,j
=
∂ logλ
∂ logA i,j
=
A i,j
λ
v i w i
〈v | w〉
(10.8)
The elasticities of the matrix elements sum to 1.0 (Caswell et al. 1984; deKroon
et al. 1986), so elasticity analysis allows us to compare the effects of changes in
parameters that are not on the same scale, such as fecundity and annual growth
probabilities (Caswell 1989). For example, we use elasticities to compare the
impact of a 10% increase in annual fecundity versus a 10% increase in the
probability of surviving and remaining in a stage. Because the effect of a management proposal is often estimated as a proportional change in a vital rate, rather
than an absolute change, elasticity analysis can be a highly useful comparative
measure.
Often, we want to know the elasticity of a lower level variable that is used to
calculate matrix entries, such as annual survival (σ) or annual mortality (1 − σ).
The partial derivative may be calculated for any variable (x) in the model
x
λ
∂λ
∂x
=
x
λ
∑ i,j
∂λ
∂A i,j
∂A i,j
∂x
(10.9)
or the sum of the partial derivatives with respect to x. This elasticity can be
estimated by the average change in λ as x is increased and decreased by a small
percentage:
S prop =
λ x+x(0.01) − λ x−x(0.01)
λ x 0.02
(10.10)
where λ x+x(0.01) is the new λ calculated for the matrix as the parameter is increased
or decreased by 1%. In the denominator, the λ from the original unperturbed
matrix is multiplied by the total change in x (in this example, 0.01 + 0.01 = 0.02, or
2%). This method for calculating proportional sensitivities is time-consuming but
can be useful when the partial derivative in Equation (10.9) is difficult to compute.
Also, this equation can be used to compare the relative effects of parameter
changes on other response variables, such as stage distribution and population size
in more complex nonlinear models.
Estimating the Effects of Management Alternatives
Elasticity analysis as outlined above can help managers decide which life stages
are in most need of protection and which model parameters need additional
research (Schemske et al. 1994). The next step is to determine which vital rates are
most likely to be affected by a particular management proposal. By calculating λ
for matrices that reflect the new vital rates imposed by a particular management
plan, we can compare qualitatively the potential impacts of an array of proposals.
To get an idea of the time scale needed to assess the effect of a management plan,
we can use the growth rate and stable stage distribution from each new model to
plot the equilibrium population size over time (e.g., Crowder et al. 1994; see