

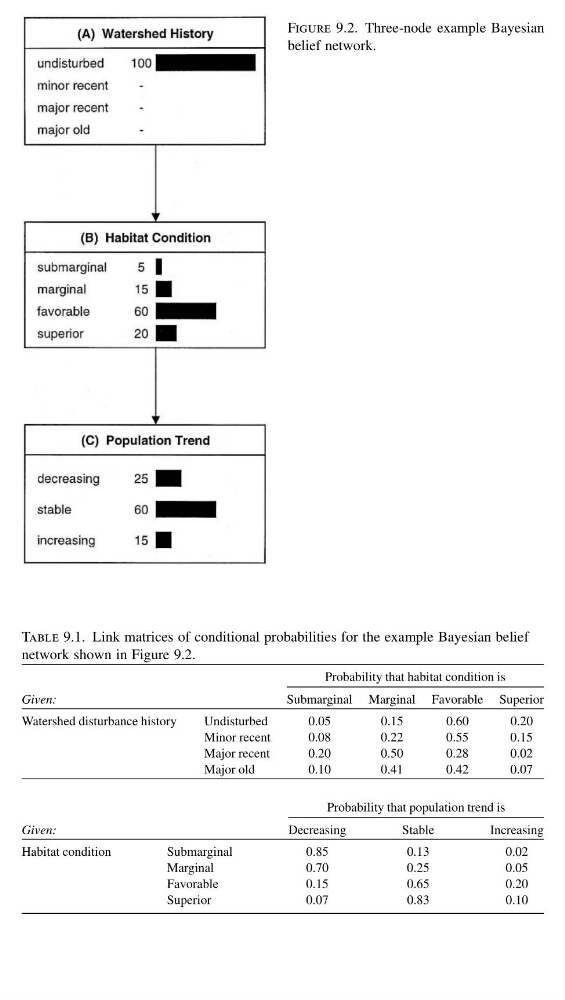
Figure 9.2. Three-node example Bayesian
belief network.
Table 9.1. Link matrices of conditional probabilities for the example Bayesian belief
network shown in Figure 9.2.
Given:
Probability that habitat condition is
Submarginal Marginal Favorable Superior
Watershed disturbance history
Undisturbed
0.05
0.15
0.60
0.20
Minor recent
0.08
0.22
0.55
0.15
Major recent
0.20
0.50
0.28
0.02
Major old
0.10
0.41
0.42
0.07
Given:
Probability that population trend is
Decreasing
Stable
Increasing
Habitat condition
Submarginal
0.85
0.13
0.02
Marginal
0.70
0.25
0.05
Favorable
0.15
0.65
0.20
Superior
0.07
0.83
0.10
belief network.
Table 9.1. Link matrices of conditional probabilities for the example Bayesian belief
network shown in Figure 9.2.
Given:
Probability that habitat condition is
Submarginal Marginal Favorable Superior
Watershed disturbance history
Undisturbed
0.05
0.15
0.60
0.20
Minor recent
0.08
0.22
0.55
0.15
Major recent
0.20
0.50
0.28
0.02
Major old
0.10
0.41
0.42
0.07
Given:
Probability that population trend is
Decreasing
Stable
Increasing
Habitat condition
Submarginal
0.85
0.13
0.02
Marginal
0.70
0.25
0.05
Favorable
0.15
0.65
0.20
Superior
0.07
0.83
0.10