

104
Barbara L. Taylor and Paul R. Wade
that all PBRs are taken. For each trial, 2,000 replications are done and the mean,
5th, and 95th percentiles of the distribution are calculated and saved.
Results
We present results that illustrate the special properties of this management
scheme. More detailed results of each type of trial are in Wade (1998). Samples of
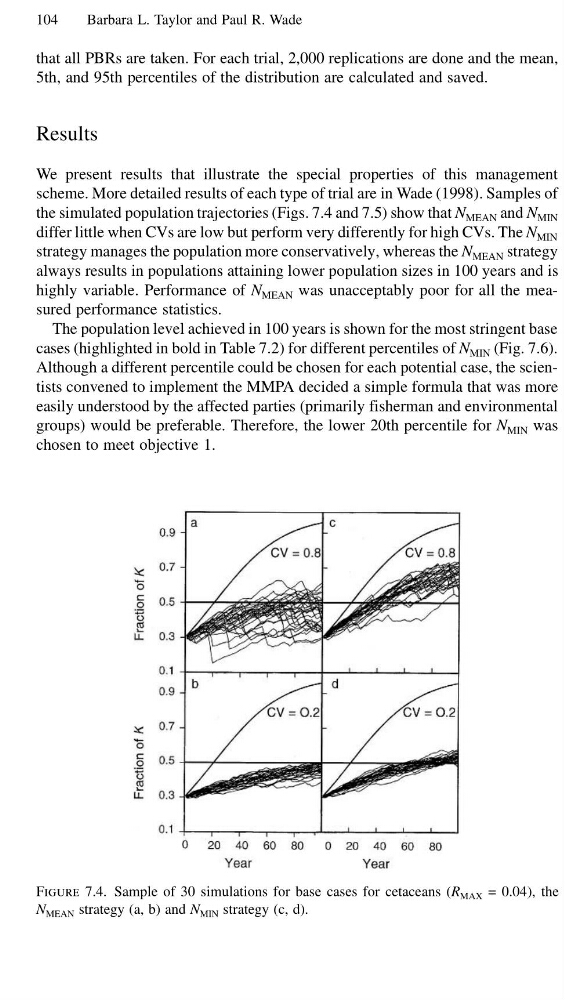
the simulated population trajectories (Figs. 7.4 and 7.5) show that N MEAN and N MIN
differ little when CVs are low but perform very differently for high CVs. The N MIN
strategy manages the population more conservatively, whereas the N MEAN strategy
always results in populations attaining lower population sizes in 100 years and is
highly variable. Performance of N MEAN was unacceptably poor for all the measured performance statistics.
The population level achieved in 100 years is shown for the most stringent base
cases (highlighted in bold in Table 7.2) for different percentiles of N MIN (Fig. 7.6).
Although a different percentile could be chosen for each potential case, the scientists convened to implement the MMPA decided a simple formula that was more
easily understood by the affected parties (primarily fisherman and environmental
groups) would be preferable. Therefore, the lower 20th percentile for N MIN was
chosen to meet objective 1.
Figure 7.4. Sample of 30 simulations for base cases for cetaceans (R MAX = 0.04), the
N MEAN strategy (a, b) and N MIN strategy (c, d).
Barbara L. Taylor and Paul R. Wade
that all PBRs are taken. For each trial, 2,000 replications are done and the mean,
5th, and 95th percentiles of the distribution are calculated and saved.
Results
We present results that illustrate the special properties of this management
scheme. More detailed results of each type of trial are in Wade (1998). Samples of
the simulated population trajectories (Figs. 7.4 and 7.5) show that N MEAN and N MIN
differ little when CVs are low but perform very differently for high CVs. The N MIN
strategy manages the population more conservatively, whereas the N MEAN strategy
always results in populations attaining lower population sizes in 100 years and is
highly variable. Performance of N MEAN was unacceptably poor for all the measured performance statistics.
The population level achieved in 100 years is shown for the most stringent base
cases (highlighted in bold in Table 7.2) for different percentiles of N MIN (Fig. 7.6).
Although a different percentile could be chosen for each potential case, the scientists convened to implement the MMPA decided a simple formula that was more
easily understood by the affected parties (primarily fisherman and environmental
groups) would be preferable. Therefore, the lower 20th percentile for N MIN was
chosen to meet objective 1.
Figure 7.4. Sample of 30 simulations for base cases for cetaceans (R MAX = 0.04), the
N MEAN strategy (a, b) and N MIN strategy (c, d).