

90
Michael J. Firko and Edward V. Podleckis
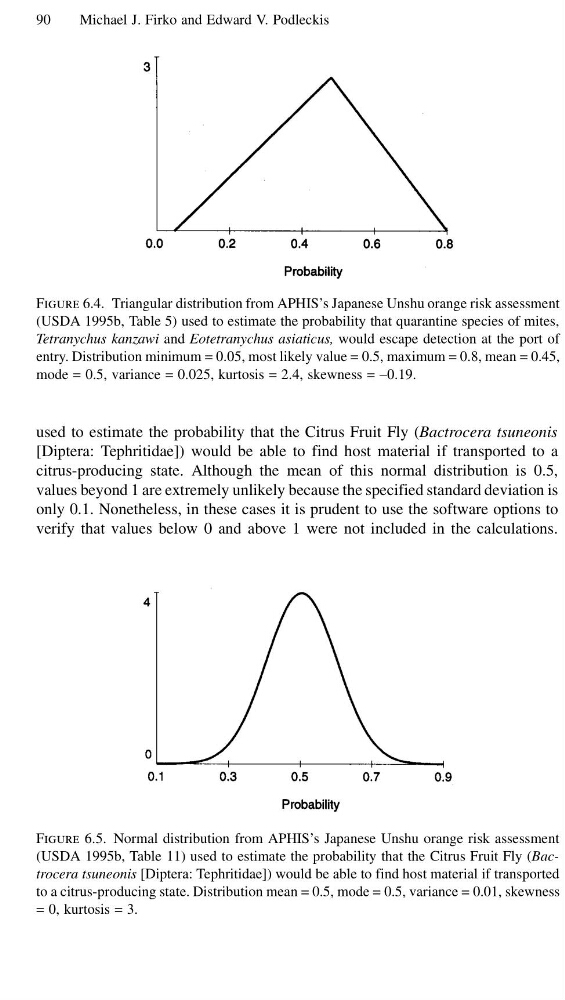
Figure 6.4. Triangular distribution from APHIS’s Japanese Unshu orange risk assessment
(USDA 1995b, Table 5) used to estimate the probability that quarantine species of mites,
Tetranychus kanzawi and Eotetranychus asiaticus, would escape detection at the port of
entry. Distribution minimum = 0.05, most likely value = 0.5, maximum = 0.8, mean = 0.45,
mode = 0.5, variance = 0.025, kurtosis = 2.4, skewness = −0.19.
used to estimate the probability that the Citrus Fruit Fly (Bactrocera tsuneonis
[Diptera: Tephritidae]) would be able to find host material if transported to a
citrus-producing state. Although the mean of this normal distribution is 0.5,
values beyond 1 are extremely unlikely because the specified standard deviation is
only 0.1. Nonetheless, in these cases it is prudent to use the software options to
verify that values below 0 and above 1 were not included in the calculations.
Figure 6.5. Normal distribution from APHIS’s Japanese Unshu orange risk assessment
(USDA 1995b, Table 11) used to estimate the probability that the Citrus Fruit Fly (Bactrocera tsuneonis [Diptera: Tephritidae]) would be able to find host material if transported
to a citrus-producing state. Distribution mean = 0.5, mode = 0.5, variance = 0.01, skewness
= 0, kurtosis = 3.
Michael J. Firko and Edward V. Podleckis
Figure 6.4. Triangular distribution from APHIS’s Japanese Unshu orange risk assessment
(USDA 1995b, Table 5) used to estimate the probability that quarantine species of mites,
Tetranychus kanzawi and Eotetranychus asiaticus, would escape detection at the port of
entry. Distribution minimum = 0.05, most likely value = 0.5, maximum = 0.8, mean = 0.45,
mode = 0.5, variance = 0.025, kurtosis = 2.4, skewness = −0.19.
used to estimate the probability that the Citrus Fruit Fly (Bactrocera tsuneonis
[Diptera: Tephritidae]) would be able to find host material if transported to a
citrus-producing state. Although the mean of this normal distribution is 0.5,
values beyond 1 are extremely unlikely because the specified standard deviation is
only 0.1. Nonetheless, in these cases it is prudent to use the software options to
verify that values below 0 and above 1 were not included in the calculations.
Figure 6.5. Normal distribution from APHIS’s Japanese Unshu orange risk assessment
(USDA 1995b, Table 11) used to estimate the probability that the Citrus Fruit Fly (Bactrocera tsuneonis [Diptera: Tephritidae]) would be able to find host material if transported
to a citrus-producing state. Distribution mean = 0.5, mode = 0.5, variance = 0.01, skewness
= 0, kurtosis = 3.