

322
<0
a
'"
...
c
0
'U
~(')
"0
e c.
'"
o
1975
~
b
c
.Q
tl 0
-5 '"
e c.
o
1975
1980
1980
1985
year
1985
year
J. van der Meer et al.
1990
1995
1990
1995
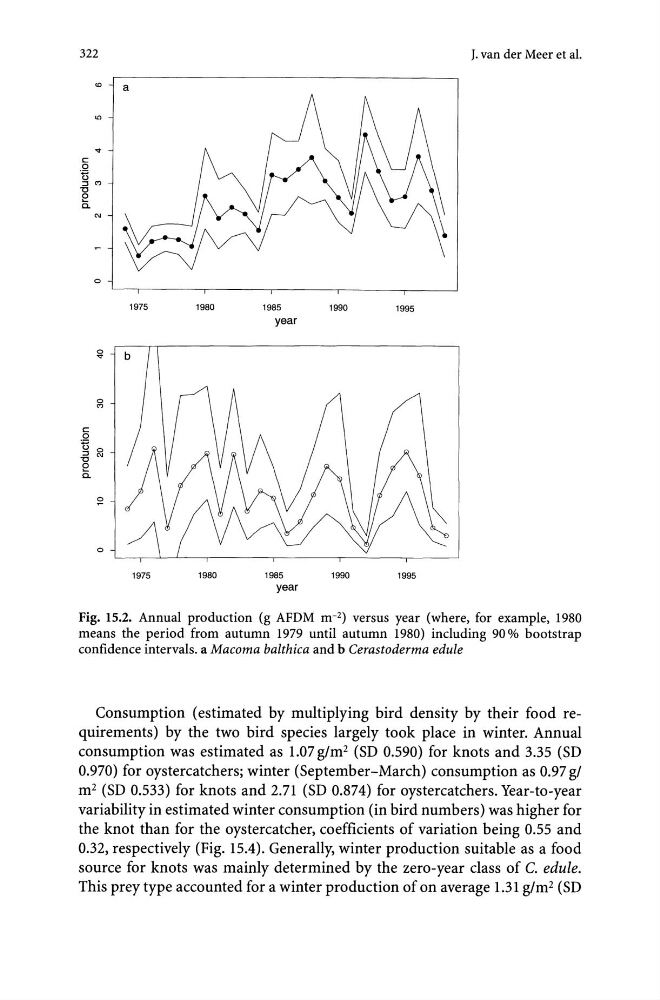
Fig. 15.2. Annual production (g AFDM m- 2 ) versus year (where, for example, 1980
means the period from autumn 1979 until autumn 1980) including 90 % bootstrap
confidence intervals. a Macoma balthica and b Cerastoderma edule
Consumption (estimated by multiplying bird density by their food requirements) by the two bird species largely took place in winter. Annual
consumption was estimated as 1.07 g/m2 (SD 0.590) for knots and 3.35 (SD
0.970) for oystercatchers; winter (September-March) consumption as 0.97 g/
m 2 (SD 0.533) for knots and 2.71 (SD 0.874) for oystercatchers. Year-to-year
variability in estimated winter consumption (in bird numbers) was higher for
the knot than for the oystercatcher, coefficients of variation being 0.55 and
0.32, respectively (Fig. 15.4). Generally, winter production suitable as a food
source for knots was mainly determined by the zero-year class of C. edule.
This prey type accounted for a winter production of on average 1.31 g/m2 (SD
<0
a
'"
...
c
0
'U
~(')
"0
e c.
'"
o
1975
~
b
c
.Q
tl 0
-5 '"
e c.
o
1975
1980
1980
1985
year
1985
year
J. van der Meer et al.
1990
1995
1990
1995
Fig. 15.2. Annual production (g AFDM m- 2 ) versus year (where, for example, 1980
means the period from autumn 1979 until autumn 1980) including 90 % bootstrap
confidence intervals. a Macoma balthica and b Cerastoderma edule
Consumption (estimated by multiplying bird density by their food requirements) by the two bird species largely took place in winter. Annual
consumption was estimated as 1.07 g/m2 (SD 0.590) for knots and 3.35 (SD
0.970) for oystercatchers; winter (September-March) consumption as 0.97 g/
m 2 (SD 0.533) for knots and 2.71 (SD 0.874) for oystercatchers. Year-to-year
variability in estimated winter consumption (in bird numbers) was higher for
the knot than for the oystercatcher, coefficients of variation being 0.55 and
0.32, respectively (Fig. 15.4). Generally, winter production suitable as a food
source for knots was mainly determined by the zero-year class of C. edule.
This prey type accounted for a winter production of on average 1.31 g/m2 (SD