

128
Total
Physical
Bioturbation
Energy (waves. cUlTents)
G.C.Cadee
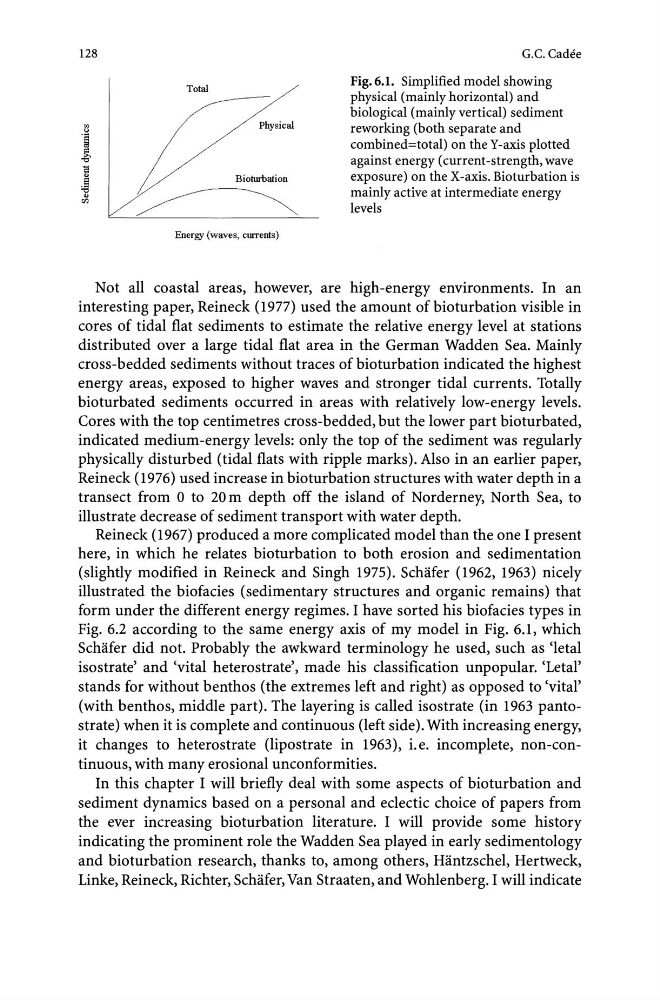
Fig.6.1. Simplified model showing
physical (mainly horizontal) and
biological (mainly vertical) sediment
reworking (both separate and
combined=total) on the Y-axis plotted
against energy (current -strength, wave
exposure) on the X-axis. Bioturbation is
mainly active at intermediate energy
levels
Not all coastal areas, however, are high-energy environments. In an
interesting paper, Reineck (1977) used the amount of bioturbation visible in
cores of tidal flat sediments to estimate the relative energy level at stations
distributed over a large tidal flat area in the German Wadden Sea. Mainly
cross-bedded sediments without traces of bioturbation indicated the highest
energy areas, exposed to higher waves and stronger tidal currents. Totally
bioturbated sediments occurred in areas with relatively low-energy levels.
Cores with the top centimetres cross-bedded, but the lower part bioturbated,
indicated medium-energy levels: only the top of the sediment was regularly
physically disturbed (tidal flats with ripple marks). Also in an earlier paper,
Reineck (1976) used increase in bioturbation structures with water depth in a
transect from 0 to 20 m depth off the island of Norderney, North Sea, to
illustrate decrease of sediment transport with water depth.
Reineck (1967) produced a more complicated model than the one I present
here, in which he relates bioturbation to both erosion and sedimentation
(slightly modified in Reineck and Singh 1975). Schafer (1962, 1963) nicely
illustrated the biofacies (sedimentary structures and organic remains) that
form under the different energy regimes. I have sorted his biofacies types in
Fig. 6.2 according to the same energy axis of my model in Fig. 6.1, which
Schafer did not. Probably the awkward terminology he used, such as 'letal
isostrate' and 'vital heterostrate', made his classification unpopular. 'Letal'
stands for without benthos (the extremes left and right) as opposed to 'vital'
(with benthos, middle part). The layering is called isostrate (in 1963 pantostrate) when it is complete and continuous (left side). With increasing energy,
it changes to heterostrate (lipostrate in 1963), i.e. incomplete, non-continuous, with many erosional unconformities.
In this chapter I will briefly deal with some aspects of bioturbation and
sediment dynamics based on a personal and eclectic choice of papers from
the ever increasing bioturbation literature. I will provide some history
indicating the prominent role the Wadden Sea played in early sedimentology
and bioturbation research, thanks to, among others, Hantzschel, Hertweck,
Linke, Reineck, Richter, Schafer, Van Straaten, and Wohlenberg. I will indicate
Total
Physical
Bioturbation
Energy (waves. cUlTents)
G.C.Cadee
Fig.6.1. Simplified model showing
physical (mainly horizontal) and
biological (mainly vertical) sediment
reworking (both separate and
combined=total) on the Y-axis plotted
against energy (current -strength, wave
exposure) on the X-axis. Bioturbation is
mainly active at intermediate energy
levels
Not all coastal areas, however, are high-energy environments. In an
interesting paper, Reineck (1977) used the amount of bioturbation visible in
cores of tidal flat sediments to estimate the relative energy level at stations
distributed over a large tidal flat area in the German Wadden Sea. Mainly
cross-bedded sediments without traces of bioturbation indicated the highest
energy areas, exposed to higher waves and stronger tidal currents. Totally
bioturbated sediments occurred in areas with relatively low-energy levels.
Cores with the top centimetres cross-bedded, but the lower part bioturbated,
indicated medium-energy levels: only the top of the sediment was regularly
physically disturbed (tidal flats with ripple marks). Also in an earlier paper,
Reineck (1976) used increase in bioturbation structures with water depth in a
transect from 0 to 20 m depth off the island of Norderney, North Sea, to
illustrate decrease of sediment transport with water depth.
Reineck (1967) produced a more complicated model than the one I present
here, in which he relates bioturbation to both erosion and sedimentation
(slightly modified in Reineck and Singh 1975). Schafer (1962, 1963) nicely
illustrated the biofacies (sedimentary structures and organic remains) that
form under the different energy regimes. I have sorted his biofacies types in
Fig. 6.2 according to the same energy axis of my model in Fig. 6.1, which
Schafer did not. Probably the awkward terminology he used, such as 'letal
isostrate' and 'vital heterostrate', made his classification unpopular. 'Letal'
stands for without benthos (the extremes left and right) as opposed to 'vital'
(with benthos, middle part). The layering is called isostrate (in 1963 pantostrate) when it is complete and continuous (left side). With increasing energy,
it changes to heterostrate (lipostrate in 1963), i.e. incomplete, non-continuous, with many erosional unconformities.
In this chapter I will briefly deal with some aspects of bioturbation and
sediment dynamics based on a personal and eclectic choice of papers from
the ever increasing bioturbation literature. I will provide some history
indicating the prominent role the Wadden Sea played in early sedimentology
and bioturbation research, thanks to, among others, Hantzschel, Hertweck,
Linke, Reineck, Richter, Schafer, Van Straaten, and Wohlenberg. I will indicate