

74
C. Sehafer-Neth . K. Stattegger
'"
~o<
.,<:;'v
~
~'i>
til
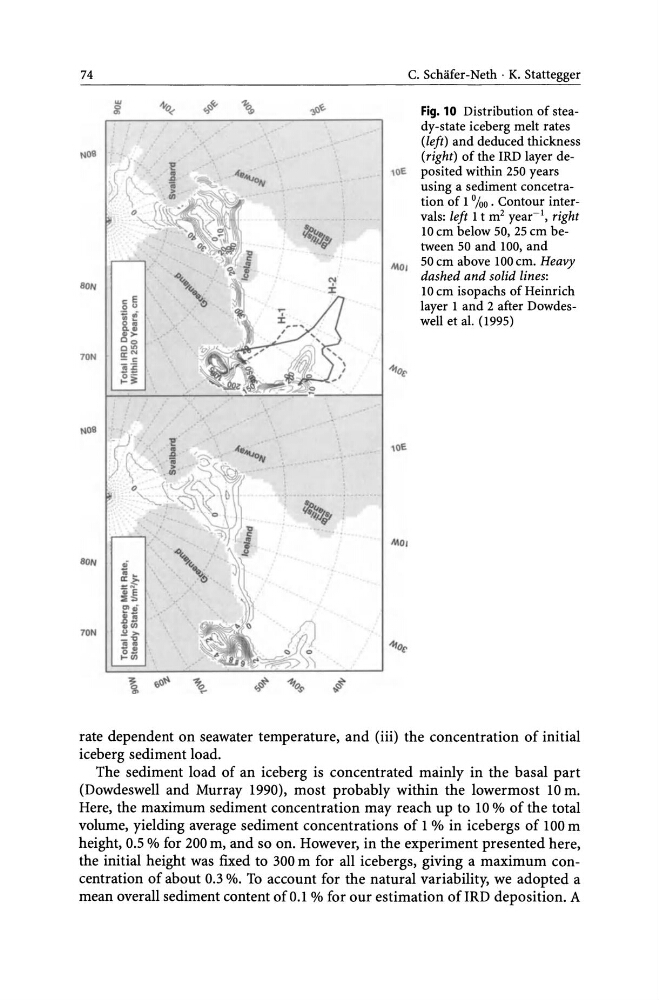
Fig. 10 Distribution of steady-state iceberg melt rates
(left) and deduced thickness
NOlI
(right) of the IRD layer de,oE posited within 250 years
using a sediment eoneetration of 1 %0 . Contour intervals: left 1 t m 2 year-I, right
~"
10 em below 50, 25 em be-ti"l'
tween 50 and 100, and
Mo, 50 em above 100 em. Heavy
dashed and solid lines:
BON
10 em isopaehs of Heinrich
c E
o u
layer 1 and 2 after Dowdes-;::.;
.. ~
well et al. (1995)
0 ..
a, "
.!l> C>
C"'
70N
a: N
-c:
'ii::C
-i/o£,
~~
1'109
,oE
~" "'i,,1'
BON
~"
OJ ~
a:~
'i'E ::IE ...
~Gi'
,8S
"til
70N
.!!,..
- "
....
-.,
~iii
\,
",0'"
?o ...
!:>~
<:!
-ft'o,r
$'
"
rate dependent on seawater temperature, and (iii) the concentration of initial
iceberg sediment load.
The sediment load of an iceberg is concentrated mainly in the basal part
(Dowdeswell and Murray 1990), most probably within the lowermost 10 m.
Here, the maximum sediment concentration may reach up to 10 % of the total
volume, yielding average sediment concentrations of 1 % in icebergs of 100 m
height, 0.5 % for 200 m, and so on. However, in the experiment presented here,
the initial height was fixed to 300 m for all icebergs, giving a maximum concentration of about 0.3 %. To account for the natural variability, we adopted a
mean overall sediment content of 0.1 % for our estimation ofIRD deposition. A
C. Sehafer-Neth . K. Stattegger
'"
~o<
.,<:;'v
~
~'i>
til
Fig. 10 Distribution of steady-state iceberg melt rates
(left) and deduced thickness
NOlI
(right) of the IRD layer de,oE posited within 250 years
using a sediment eoneetration of 1 %0 . Contour intervals: left 1 t m 2 year-I, right
~"
10 em below 50, 25 em be-ti"l'
tween 50 and 100, and
Mo, 50 em above 100 em. Heavy
dashed and solid lines:
BON
10 em isopaehs of Heinrich
c E
o u
layer 1 and 2 after Dowdes-;::.;
.. ~
well et al. (1995)
0 ..
a, "
.!l> C>
C"'
70N
a: N
-c:
'ii::C
-i/o£,
~~
1'109
,oE
~" "'i,,1'
BON
~"
OJ ~
a:~
'i'E ::IE ...
~Gi'
,8S
"til
70N
.!!,..
- "
....
-.,
~iii
\,
",0'"
?o ...
!:>~
<:!
-ft'o,r
$'
"
rate dependent on seawater temperature, and (iii) the concentration of initial
iceberg sediment load.
The sediment load of an iceberg is concentrated mainly in the basal part
(Dowdeswell and Murray 1990), most probably within the lowermost 10 m.
Here, the maximum sediment concentration may reach up to 10 % of the total
volume, yielding average sediment concentrations of 1 % in icebergs of 100 m
height, 0.5 % for 200 m, and so on. However, in the experiment presented here,
the initial height was fixed to 300 m for all icebergs, giving a maximum concentration of about 0.3 %. To account for the natural variability, we adopted a
mean overall sediment content of 0.1 % for our estimation ofIRD deposition. A