

64
C. Schafer-Neth . K. Stattegger
2
The Ocean Circulation Model
For the experiments, we use SCINNA ('Sensitivity and Circulation of the
Northern North Atlantic', Schafer-Neth 1994), a three-dimensional prognostic
Ocean General Circulation Model employing the primitive equations based on
the Modular Ocean Model by Pacanowski et al. 1993). On a rotated spherical
grid where the model's north pole is located at 180 W /30 N, the model domain
covers the GIN Seas and parts of the neighboring basins (Fig. 3). The horizontal grid spacing is OS (~ 55 km) in latitude and longitude, and vertically there
are 17 levels with thicknesses increasing from 50 m at the top to 1000 m at the
bottom of the deepest basins, enabling a realistic representation of topography.
Test runs forced with modern sea surface temperatures, salinities, and wind
stress reproduced the modern oceanography reasonably well (Haupt et al.
1994, 1995). After aiding the paleoceanographic reconstruction of the LGM,
that is, the reconstruction of physically consistent temperature and salinity
distributions, with the associated circulation patterns from the proxy data
(Schafer-Neth 1994,1997), SCINNA is now being applied to study the deglaciation phases since the LGM.
3
Idealized Icebergs
Real icebergs exist in a great variety of sizes and shapes that are too complex to
be implemented in a general circulation model. Instead, to keep the model
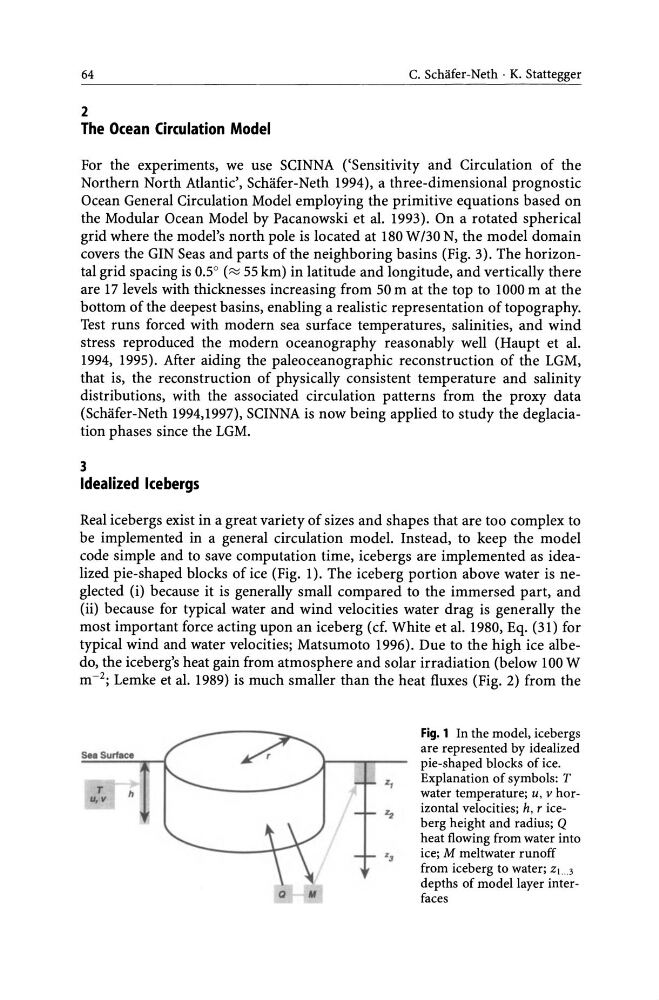
code simple and to save computation time, icebergs are implemented as idealized pie-shaped blocks of ice (Fig. 1). The iceberg portion above water is neglected (i) because it is generally small compared to the immersed part, and
(ii) because for typical water and wind velocities water drag is generally the
most important force acting upon an iceberg (cf. White et al. 1980, Eq. (31) for
typical wind and water velocities; Matsumoto 1996). Due to the high ice albedo, the iceberg's heat gain from atmosphere and solar irradiation (below 100 W
m- 2 ; Lemke et al. 1989) is much smaller than the heat fluxes (Fig. 2) from the
Sea Surface
T
u, v
h
Q
"
Fig. 1 In the model, icebergs
are represented by idealized
pie-shaped blocks of ice.
Explanation of symbols: T
water temperature; u, v horizontal velocities; h, r iceberg height and radius; Q
heat flowing from water into
ice; M meltwater runoff
from iceberg to water; Zl...3
depths of model layer interfaces
C. Schafer-Neth . K. Stattegger
2
The Ocean Circulation Model
For the experiments, we use SCINNA ('Sensitivity and Circulation of the
Northern North Atlantic', Schafer-Neth 1994), a three-dimensional prognostic
Ocean General Circulation Model employing the primitive equations based on
the Modular Ocean Model by Pacanowski et al. 1993). On a rotated spherical
grid where the model's north pole is located at 180 W /30 N, the model domain
covers the GIN Seas and parts of the neighboring basins (Fig. 3). The horizontal grid spacing is OS (~ 55 km) in latitude and longitude, and vertically there
are 17 levels with thicknesses increasing from 50 m at the top to 1000 m at the
bottom of the deepest basins, enabling a realistic representation of topography.
Test runs forced with modern sea surface temperatures, salinities, and wind
stress reproduced the modern oceanography reasonably well (Haupt et al.
1994, 1995). After aiding the paleoceanographic reconstruction of the LGM,
that is, the reconstruction of physically consistent temperature and salinity
distributions, with the associated circulation patterns from the proxy data
(Schafer-Neth 1994,1997), SCINNA is now being applied to study the deglaciation phases since the LGM.
3
Idealized Icebergs
Real icebergs exist in a great variety of sizes and shapes that are too complex to
be implemented in a general circulation model. Instead, to keep the model
code simple and to save computation time, icebergs are implemented as idealized pie-shaped blocks of ice (Fig. 1). The iceberg portion above water is neglected (i) because it is generally small compared to the immersed part, and
(ii) because for typical water and wind velocities water drag is generally the
most important force acting upon an iceberg (cf. White et al. 1980, Eq. (31) for
typical wind and water velocities; Matsumoto 1996). Due to the high ice albedo, the iceberg's heat gain from atmosphere and solar irradiation (below 100 W
m- 2 ; Lemke et al. 1989) is much smaller than the heat fluxes (Fig. 2) from the
Sea Surface
T
u, v
h
Q
"
Fig. 1 In the model, icebergs
are represented by idealized
pie-shaped blocks of ice.
Explanation of symbols: T
water temperature; u, v horizontal velocities; h, r iceberg height and radius; Q
heat flowing from water into
ice; M meltwater runoff
from iceberg to water; Zl...3
depths of model layer interfaces