

58
W. PuIs· T. Pohlmann· J. Slindermann
were weather conditions "normal" or were they extraordinary? This consideration also gives an impression of the seasonal variability of storm events. As we
know, the frequency and the intensity of storms directly affect the SPM regime.
The data used for the assessment of the NSP period's weather conditions are
computed time series of the bed shear velocity, u., at site A in the Southern Bight
(Fig. 2) for the 10 years 1985-1994. The frequency of the u.-data is 72 values per
day (time step: 20 min). In order to suppress the daily tidal variation, daily averages of u. were calculated. These daily averages are used for producing box and
whisker plots (Figs. 17 and 18).
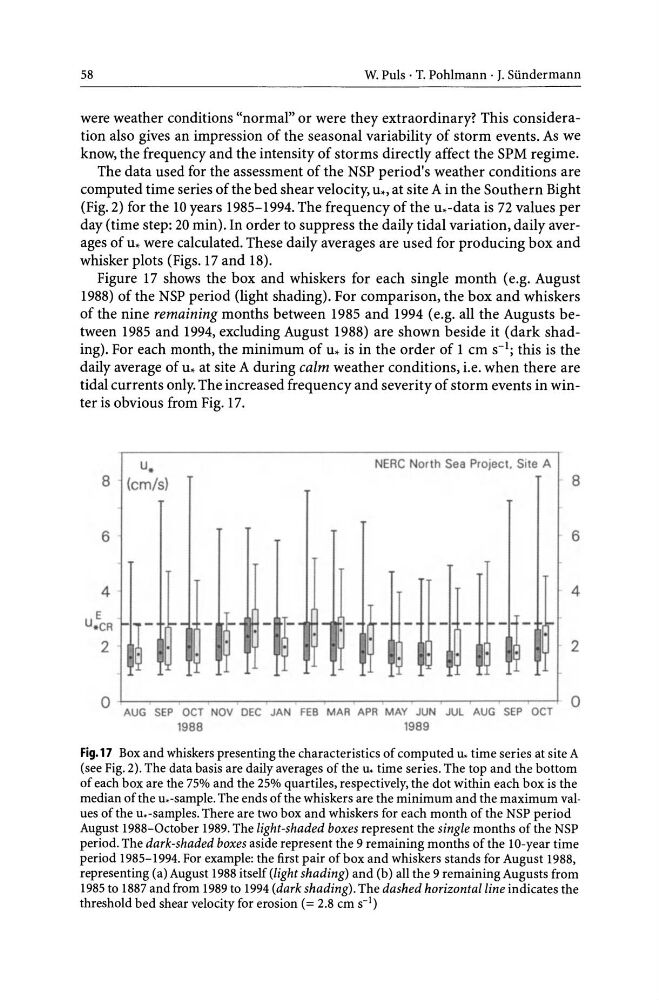
Figure 17 shows the box and whiskers for each single month (e.g. August
1988) of the NSP period (light shading). For comparison, the box and whiskers
of the nine remaining months between 1985 and 1994 (e.g. all the Augusts between 1985 and 1994, excluding August 1988) are shown beside it (dark shading). For each month, the minimum of u. is in the order of 1 cm S-I; this is the
daily average of u. at site A during calm weather conditions, i.e. when there are
tidal currents only. The increased frequency and severity of storm events in winter is obvious from Fig. 17.
u.
NERC North Sea Project. Site A
8 (cm/s)
8
6
6
4
I- i4
E
t r ~- l
u.CR
r
2
2
o AUG SEP OCT NOV DEC JAN FEB MAR APR MAY JUN JUL AUG SEP OCT 0
1988
1989
Fig.17 Box and whiskers presenting the characteristics of computed \L- time series at site A
(see Fig. 2). The data basis are daily averages of the \L- time series. The top and the bottom
of each box are the 75% and the 25% quartiles, respectively, the dot within each box is the
median of the u.-sample. The ends of the whiskers are the minimum and the maximum val·
ues of the u.-samples. There are two box and whiskers for each month of the NSP period
August 1988-0ctober 1989. The light-shaded boxes represent the single months of the NSP
period. The dark-shaded boxes aside represent the 9 remaining months of the lO-year time
period 1985-1994. For example: the first pair of box and whiskers stands for August 1988,
representing (a) August 1988 itself (light shading) and (b) all the 9 remaining Augusts from
1985 to 1887 and from 1989 to 1994 (dark shading). The dashed horizontal line indicates the
threshold bed shear velocity for erosion (= 2.8 cm S-I)
W. PuIs· T. Pohlmann· J. Slindermann
were weather conditions "normal" or were they extraordinary? This consideration also gives an impression of the seasonal variability of storm events. As we
know, the frequency and the intensity of storms directly affect the SPM regime.
The data used for the assessment of the NSP period's weather conditions are
computed time series of the bed shear velocity, u., at site A in the Southern Bight
(Fig. 2) for the 10 years 1985-1994. The frequency of the u.-data is 72 values per
day (time step: 20 min). In order to suppress the daily tidal variation, daily averages of u. were calculated. These daily averages are used for producing box and
whisker plots (Figs. 17 and 18).
Figure 17 shows the box and whiskers for each single month (e.g. August
1988) of the NSP period (light shading). For comparison, the box and whiskers
of the nine remaining months between 1985 and 1994 (e.g. all the Augusts between 1985 and 1994, excluding August 1988) are shown beside it (dark shading). For each month, the minimum of u. is in the order of 1 cm S-I; this is the
daily average of u. at site A during calm weather conditions, i.e. when there are
tidal currents only. The increased frequency and severity of storm events in winter is obvious from Fig. 17.
u.
NERC North Sea Project. Site A
8 (cm/s)
8
6
6
4
I- i4
E
t r ~- l
u.CR
r
2
2
o AUG SEP OCT NOV DEC JAN FEB MAR APR MAY JUN JUL AUG SEP OCT 0
1988
1989
Fig.17 Box and whiskers presenting the characteristics of computed \L- time series at site A
(see Fig. 2). The data basis are daily averages of the \L- time series. The top and the bottom
of each box are the 75% and the 25% quartiles, respectively, the dot within each box is the
median of the u.-sample. The ends of the whiskers are the minimum and the maximum val·
ues of the u.-samples. There are two box and whiskers for each month of the NSP period
August 1988-0ctober 1989. The light-shaded boxes represent the single months of the NSP
period. The dark-shaded boxes aside represent the 9 remaining months of the lO-year time
period 1985-1994. For example: the first pair of box and whiskers stands for August 1988,
representing (a) August 1988 itself (light shading) and (b) all the 9 remaining Augusts from
1985 to 1887 and from 1989 to 1994 (dark shading). The dashed horizontal line indicates the
threshold bed shear velocity for erosion (= 2.8 cm S-I)