

Risk, Uncertainty and Priorities - Quantitative Models
o
I
I
t = 0.8 MYBP
t =0.5 MYB~
t = 0.2 MYBP
t = 0.15 MYBP
t=0.1 MY8P
t = 0.0 MYBP
441
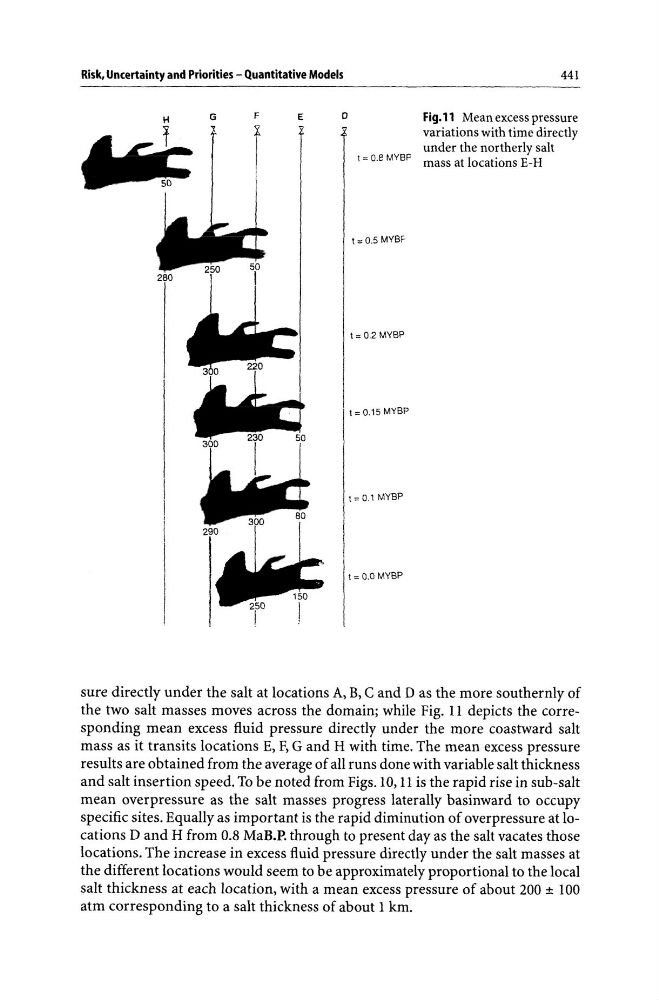
Fig.ll Mean excess pressure
variations with time directly
under the northerly salt
mass at locations E-H
sure directly under the salt at locations A, B, C and D as the more southernly of
the two salt masses moves across the domain; while Fig. 11 depicts the corresponding mean excess fluid pressure directly under the more coastward salt
mass as it transits locations E, F, G and H with time. The mean excess pressure
results are obtained from the average of all runs done with variable salt thickness
and salt insertion speed. To be noted from Figs. 10, 11 is the rapid rise in sub-salt
mean overpressure as the salt masses progress laterally basinward to occupy
specific sites. Equally as important is the rapid diminution of overpressure at locations D and H from 0.8 MaB.P. through to present day as the salt vacates those
locations. The increase in excess fluid pressure directly under the salt masses at
the different locations would seem to be approximately proportional to the local
salt thickness at each location, with a mean excess pressure of about 200 ± 100
atm corresponding to a salt thickness of about 1 km.
o
I
I
t = 0.8 MYBP
t =0.5 MYB~
t = 0.2 MYBP
t = 0.15 MYBP
t=0.1 MY8P
t = 0.0 MYBP
441
Fig.ll Mean excess pressure
variations with time directly
under the northerly salt
mass at locations E-H
sure directly under the salt at locations A, B, C and D as the more southernly of
the two salt masses moves across the domain; while Fig. 11 depicts the corresponding mean excess fluid pressure directly under the more coastward salt
mass as it transits locations E, F, G and H with time. The mean excess pressure
results are obtained from the average of all runs done with variable salt thickness
and salt insertion speed. To be noted from Figs. 10, 11 is the rapid rise in sub-salt
mean overpressure as the salt masses progress laterally basinward to occupy
specific sites. Equally as important is the rapid diminution of overpressure at locations D and H from 0.8 MaB.P. through to present day as the salt vacates those
locations. The increase in excess fluid pressure directly under the salt masses at
the different locations would seem to be approximately proportional to the local
salt thickness at each location, with a mean excess pressure of about 200 ± 100
atm corresponding to a salt thickness of about 1 km.