

392
90
80
70
80
welght% so
40
1
30
20
10
0
2
3
groups
grv-mfs
fs
5
6
C. Barcelo· V. Pawlowsky· G. Bohling
7
-
grv
ClIICS
- cs
- ms
Cl mls
Cl Is
Cl Ills
Cl Sl~
vfs-s ilt
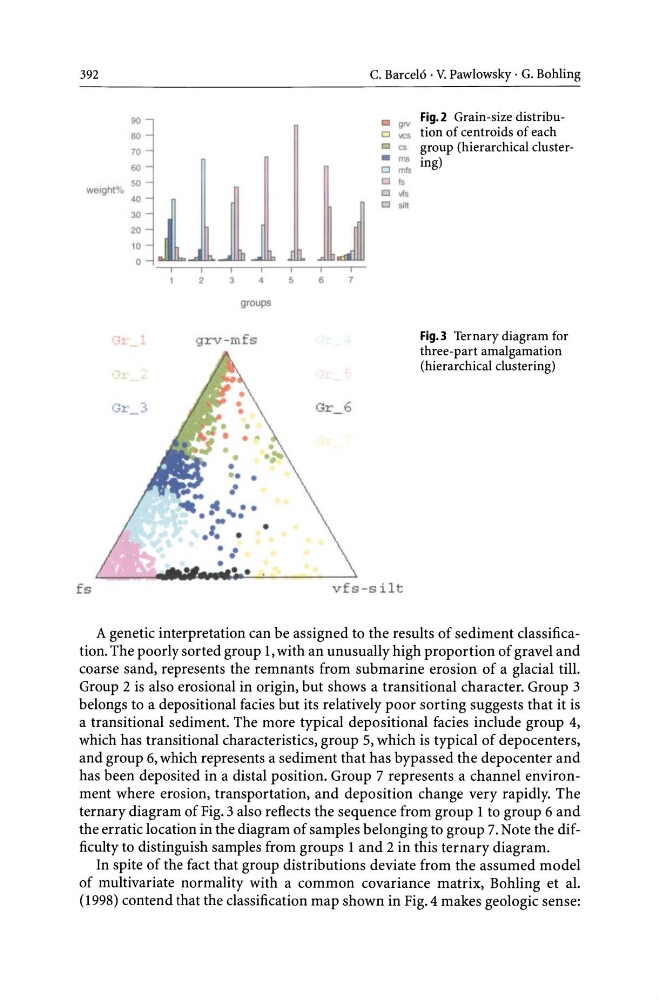
Fig.2 Grain-size distribution of centroids of each
group (hierarchical clustering)
Fig.3 Ternary diagram for
three-part amalgamation
(hierarchical clustering)
A genetic interpretation can be assigned to the results of sediment classification. The poorly sorted group 1, with an unusually high proportion of gravel and
coarse sand, represents the remnants from submarine erosion of a glacial till.
Group 2 is also erosional in origin, but shows a transitional character. Group 3
belongs to a depositional facies but its relatively poor sorting suggests that it is
a transitional sediment. The more typical depositional facies include group 4,
which has transitional characteristics, group 5, which is typical of depocenters,
and group 6, which represents a sediment that has bypassed the depocenter and
has been deposited in a distal position. Group 7 represents a channel environment where erosion, transportation, and deposition change very rapidly. The
ternary diagram of Fig. 3 also reflects the sequence from group 1 to group 6 and
the erratic location in the diagram of samples belonging to group 7. Note the difficulty to distinguish samples from groups 1 and 2 in this ternary diagram.
In spite of the fact that group distributions deviate from the assumed model
of multivariate normality with a common covariance matrix, Bohling et al.
(1998) contend that the classification map shown in Fig. 4 makes geologic sense:
90
80
70
80
welght% so
40
1
30
20
10
0
2
3
groups
grv-mfs
fs
5
6
C. Barcelo· V. Pawlowsky· G. Bohling
7
-
grv
ClIICS
- cs
- ms
Cl mls
Cl Is
Cl Ills
Cl Sl~
vfs-s ilt
Fig.2 Grain-size distribution of centroids of each
group (hierarchical clustering)
Fig.3 Ternary diagram for
three-part amalgamation
(hierarchical clustering)
A genetic interpretation can be assigned to the results of sediment classification. The poorly sorted group 1, with an unusually high proportion of gravel and
coarse sand, represents the remnants from submarine erosion of a glacial till.
Group 2 is also erosional in origin, but shows a transitional character. Group 3
belongs to a depositional facies but its relatively poor sorting suggests that it is
a transitional sediment. The more typical depositional facies include group 4,
which has transitional characteristics, group 5, which is typical of depocenters,
and group 6, which represents a sediment that has bypassed the depocenter and
has been deposited in a distal position. Group 7 represents a channel environment where erosion, transportation, and deposition change very rapidly. The
ternary diagram of Fig. 3 also reflects the sequence from group 1 to group 6 and
the erratic location in the diagram of samples belonging to group 7. Note the difficulty to distinguish samples from groups 1 and 2 in this ternary diagram.
In spite of the fact that group distributions deviate from the assumed model
of multivariate normality with a common covariance matrix, Bohling et al.
(1998) contend that the classification map shown in Fig. 4 makes geologic sense: