

Sedimentological Control Parameters and Compaction ...
095,-------------------------__ -,
0.9
---- Regression
95% confld .
. "
• •
•
~.
0.65 0.7 075 0.8 0 .85 0995
Predicted porosity
379
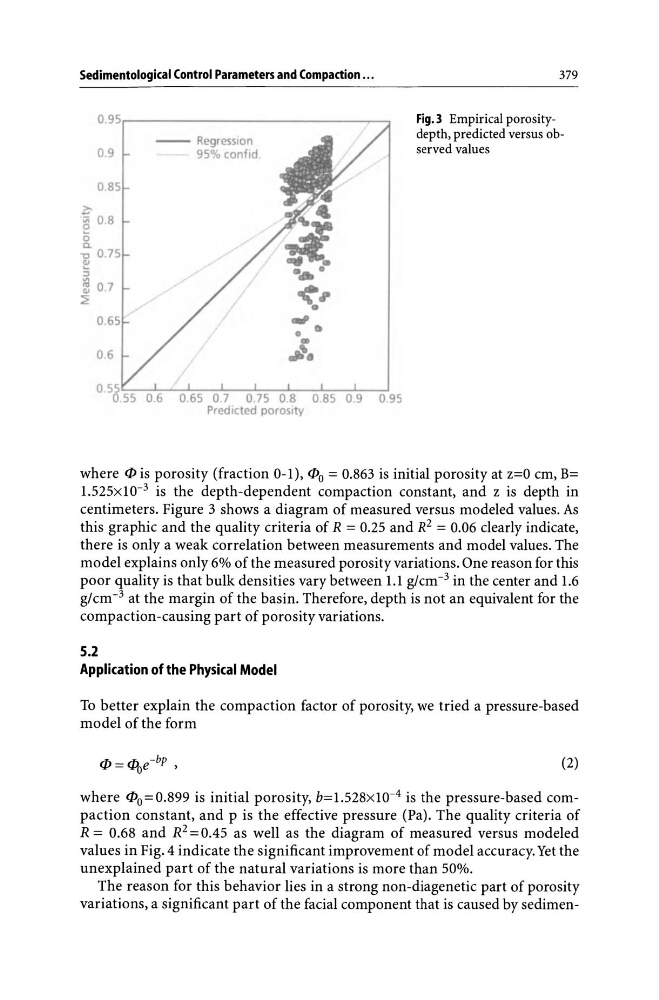
Fig.3 Empirical porositydepth, predicted versus observed values
where cP is porosity (fraction 0-1), CPo = 0.863 is initial porosity at z=O cm, B=
1.525xlO- 3 is the depth-dependent compaction constant, and z is depth in
centimeters. Figure 3 shows a diagram of measured versus modeled values. As
this graphic and the quality criteria of R = 0.25 and R2 = 0.06 clearly indicate,
there is only a weak correlation between measurements and model values. The
model explains only 6% of the measured porosity variations. One reason for this
poor quality is that bulk densities vary between 1.1 g/cm- 3 in the center and 1.6
g/cm- 3 at the margin of the basin. Therefore, depth is not an equivalent for the
compaction-causing part of porosity variations.
5.2
Application of the Physical Model
To better explain the compaction factor of porosity, we tried a pressure-based
model of the form
m. m. -bp
'P = 'Poe ,
(2)
where CPo=0.899 is initial porosity, b=1.528xlO- 4 is the pressure-based compaction constant, and p is the effective pressure (Pa). The quality criteria of
R = 0.68 and R2 = 0.45 as well as the diagram of measured versus modeled
values in Fig. 4 indicate the significant improvement of model accuracy. Yet the
unexplained part of the natural variations is more than 50%.
The reason for this behavior lies in a strong non-diagenetic part of porosity
variations, a significant part of the facial component that is caused by sedimen-
095,-------------------------__ -,
0.9
---- Regression
95% confld .
. "
• •
•
~.
0.65 0.7 075 0.8 0 .85 0995
Predicted porosity
379
Fig.3 Empirical porositydepth, predicted versus observed values
where cP is porosity (fraction 0-1), CPo = 0.863 is initial porosity at z=O cm, B=
1.525xlO- 3 is the depth-dependent compaction constant, and z is depth in
centimeters. Figure 3 shows a diagram of measured versus modeled values. As
this graphic and the quality criteria of R = 0.25 and R2 = 0.06 clearly indicate,
there is only a weak correlation between measurements and model values. The
model explains only 6% of the measured porosity variations. One reason for this
poor quality is that bulk densities vary between 1.1 g/cm- 3 in the center and 1.6
g/cm- 3 at the margin of the basin. Therefore, depth is not an equivalent for the
compaction-causing part of porosity variations.
5.2
Application of the Physical Model
To better explain the compaction factor of porosity, we tried a pressure-based
model of the form
m. m. -bp
'P = 'Poe ,
(2)
where CPo=0.899 is initial porosity, b=1.528xlO- 4 is the pressure-based compaction constant, and p is the effective pressure (Pa). The quality criteria of
R = 0.68 and R2 = 0.45 as well as the diagram of measured versus modeled
values in Fig. 4 indicate the significant improvement of model accuracy. Yet the
unexplained part of the natural variations is more than 50%.
The reason for this behavior lies in a strong non-diagenetic part of porosity
variations, a significant part of the facial component that is caused by sedimen-