

Validation of Sediment Accumulation Regions in Kansas, USA
OI;;; ..... oe:s;e~50~==l~oo 0
50
100
Miles
Kilometers
•
N
347
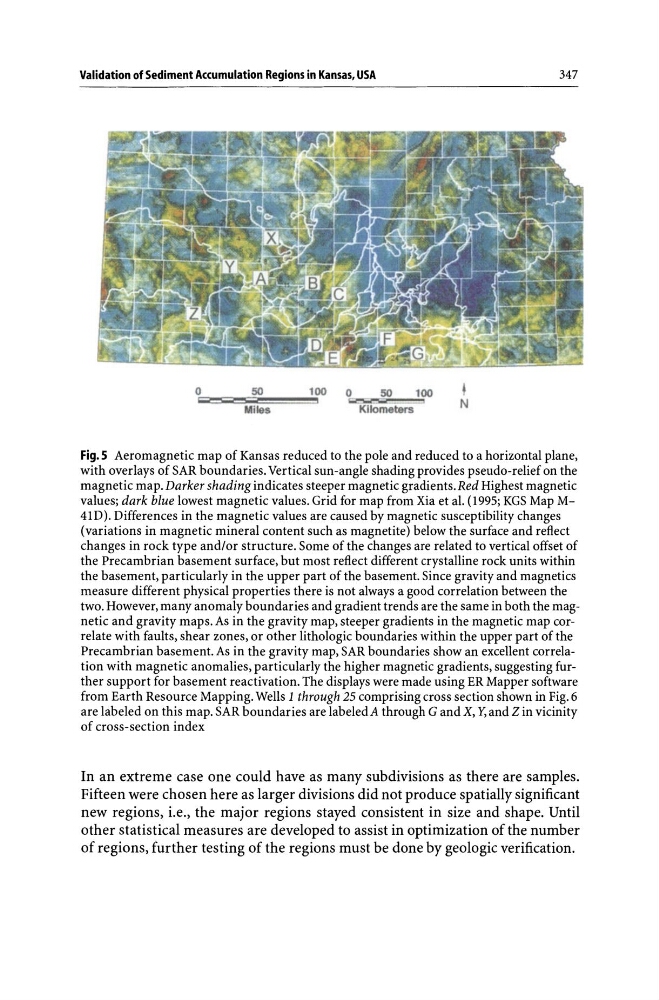
Fig. S Aeromagnetic map of Kansas reduced to the pole and reduced to a horizontal plane,
with overlays of SAR boundaries. Vertical sun-angle shading provides pseudo-relief on the
magnetic map. Darker shading indicates steeper magnetic gradients. Red Highest magnetic
values; dark blue lowest magnetic values. Grid for map from Xia et al. (1995; KGS Map M41D). Differences in the magnetic values are caused by magnetic susceptibility changes
(variations in magnetic mineral content such as magnetite) below the surface and reflect
changes in rock type and/or structure. Some of the changes are related to vertical offset of
the Precambrian basement surface, but most reflect different crystalline rock units within
the basement, particularly in the upper part of the basement. Since gravity and magnetics
measure different physical properties there is not always a good correlation between the
two. However, many anomaly boundaries and gradient trends are the same in both the magnetic and gravity maps. As in the gravity map, steeper gradients in the magnetic map correlate with faults, shear zones, or other lithologic boundaries within the upper part of the
Precambrian basement. As in the gravity map, SAR boundaries show an excellent correlation with magnetic anomalies, particularly the higher magnetic gradients, suggesting further support for basement reactivation. The displays were made using ER Mapper software
from Earth Resource Mapping. Wells 1 through 25 comprising cross section shown in Fig. 6
are labeled on this map. SAR boundaries are labeledA through G and X, 1'; and Z in vicinity
of cross-section index
In an extreme case one could have as many subdivisions as there are samples.
Fifteen were chosen here as larger divisions did not produce spatially significant
new regions, i.e., the major regions stayed consistent in size and shape. Until
other statistical measures are developed to assist in optimization of the number
of regions, further testing of the regions must be done by geologic verification.
OI;;; ..... oe:s;e~50~==l~oo 0
50
100
Miles
Kilometers
•
N
347
Fig. S Aeromagnetic map of Kansas reduced to the pole and reduced to a horizontal plane,
with overlays of SAR boundaries. Vertical sun-angle shading provides pseudo-relief on the
magnetic map. Darker shading indicates steeper magnetic gradients. Red Highest magnetic
values; dark blue lowest magnetic values. Grid for map from Xia et al. (1995; KGS Map M41D). Differences in the magnetic values are caused by magnetic susceptibility changes
(variations in magnetic mineral content such as magnetite) below the surface and reflect
changes in rock type and/or structure. Some of the changes are related to vertical offset of
the Precambrian basement surface, but most reflect different crystalline rock units within
the basement, particularly in the upper part of the basement. Since gravity and magnetics
measure different physical properties there is not always a good correlation between the
two. However, many anomaly boundaries and gradient trends are the same in both the magnetic and gravity maps. As in the gravity map, steeper gradients in the magnetic map correlate with faults, shear zones, or other lithologic boundaries within the upper part of the
Precambrian basement. As in the gravity map, SAR boundaries show an excellent correlation with magnetic anomalies, particularly the higher magnetic gradients, suggesting further support for basement reactivation. The displays were made using ER Mapper software
from Earth Resource Mapping. Wells 1 through 25 comprising cross section shown in Fig. 6
are labeled on this map. SAR boundaries are labeledA through G and X, 1'; and Z in vicinity
of cross-section index
In an extreme case one could have as many subdivisions as there are samples.
Fifteen were chosen here as larger divisions did not produce spatially significant
new regions, i.e., the major regions stayed consistent in size and shape. Until
other statistical measures are developed to assist in optimization of the number
of regions, further testing of the regions must be done by geologic verification.