

346
W. L. Watney . J. Kruger· J. c. Davis· J. Harff . R. A. Olea, . G. C. Bohling
o
50
100
0
50
100
-;'~""-~~"'M';lleeS==~
Kilometers
I
N
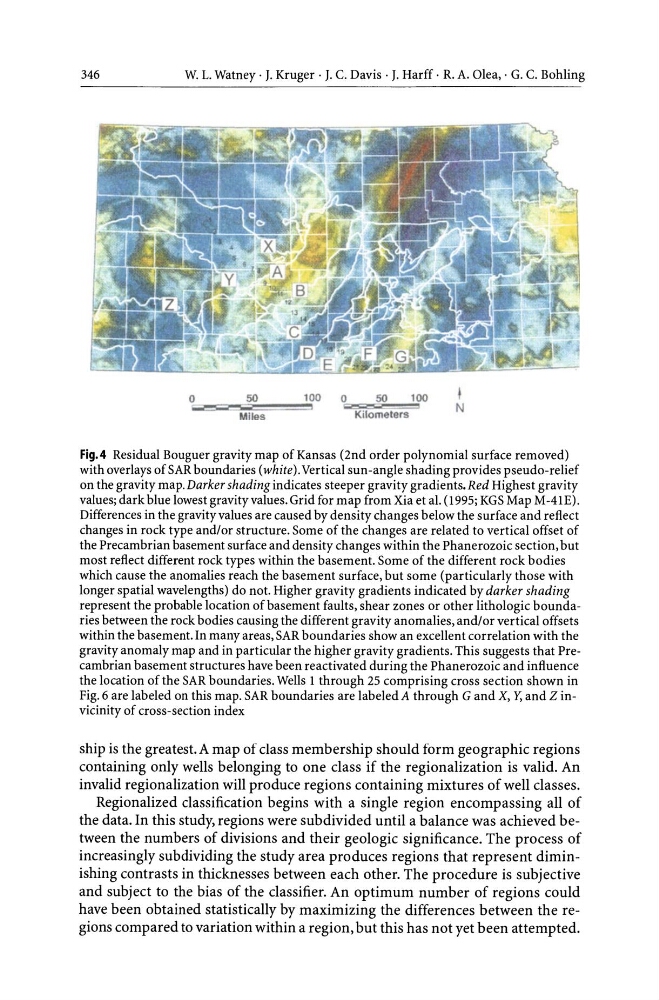
Fig.4 Residual Bouguer gravity map of Kansas (2nd order polynomial surface removed)
with overlays of SAR boundaries (white). Vertical sun -angle shading provides pseudo-relief
on the gravity map. Darker shading indicates steeper gravity gradients. Red Highest gravity
values; dark blue lowest gravity values. Grid for map from Xia et al. (1995; KGS Map M-41E).
Differences in the gravity values are caused by density changes below the surface and reflect
changes in rock type and/or structure. Some of the changes are related to vertical offset of
the Precambrian basement surface and density changes within the Phanerozoic section, but
most reflect different rock types within the basement. Some of the different rock bodies
which cause the anomalies reach the basement surface, but some (particularly those with
longer spatial wavelengths) do not. Higher gravity gradients indicated by darker shading
represent the probable location of basement faults, shear zones or other lithologic boundaries between the rock bodies causing the different gravity anomalies, and/or vertical offsets
within the basement. In many areas, SAR boundaries show an excellent correlation with the
gravity anomaly map and in particular the higher gravity gradients. This suggests that Precambrian basement structures have been reactivated during the Phanerozoic and influence
the location of the SAR boundaries. Wells 1 through 25 comprising cross section shown in
Fig.6 are labeled on this map. SAR boundaries are labeled A through G and X, 1'; and Z invicinity of cross-section index
ship is the greatest. A map of class membership should form geographic regions
containing only wells belonging to one class if the regionalization is valid. An
invalid regionalization will produce regions containing mixtures of well classes.
Regionalized classification begins with a single region encompassing all of
the data. In this study, regions were subdivided until a balance was achieved between the numbers of divisions and their geologic significance. The process of
increasingly subdividing the study area produces regions that represent diminishing contrasts in thicknesses between each other. The procedure is subjective
and subject to the bias of the classifier. An optimum number of regions could
have been obtained statistically by maximizing the differences between the regions compared to variation within a region, but this has not yet been attempted.
W. L. Watney . J. Kruger· J. c. Davis· J. Harff . R. A. Olea, . G. C. Bohling
o
50
100
0
50
100
-;'~""-~~"'M';lleeS==~
Kilometers
I
N
Fig.4 Residual Bouguer gravity map of Kansas (2nd order polynomial surface removed)
with overlays of SAR boundaries (white). Vertical sun -angle shading provides pseudo-relief
on the gravity map. Darker shading indicates steeper gravity gradients. Red Highest gravity
values; dark blue lowest gravity values. Grid for map from Xia et al. (1995; KGS Map M-41E).
Differences in the gravity values are caused by density changes below the surface and reflect
changes in rock type and/or structure. Some of the changes are related to vertical offset of
the Precambrian basement surface and density changes within the Phanerozoic section, but
most reflect different rock types within the basement. Some of the different rock bodies
which cause the anomalies reach the basement surface, but some (particularly those with
longer spatial wavelengths) do not. Higher gravity gradients indicated by darker shading
represent the probable location of basement faults, shear zones or other lithologic boundaries between the rock bodies causing the different gravity anomalies, and/or vertical offsets
within the basement. In many areas, SAR boundaries show an excellent correlation with the
gravity anomaly map and in particular the higher gravity gradients. This suggests that Precambrian basement structures have been reactivated during the Phanerozoic and influence
the location of the SAR boundaries. Wells 1 through 25 comprising cross section shown in
Fig.6 are labeled on this map. SAR boundaries are labeled A through G and X, 1'; and Z invicinity of cross-section index
ship is the greatest. A map of class membership should form geographic regions
containing only wells belonging to one class if the regionalization is valid. An
invalid regionalization will produce regions containing mixtures of well classes.
Regionalized classification begins with a single region encompassing all of
the data. In this study, regions were subdivided until a balance was achieved between the numbers of divisions and their geologic significance. The process of
increasingly subdividing the study area produces regions that represent diminishing contrasts in thicknesses between each other. The procedure is subjective
and subject to the bias of the classifier. An optimum number of regions could
have been obtained statistically by maximizing the differences between the regions compared to variation within a region, but this has not yet been attempted.