

298
C. G. ST. C. Kendall· A. Sen
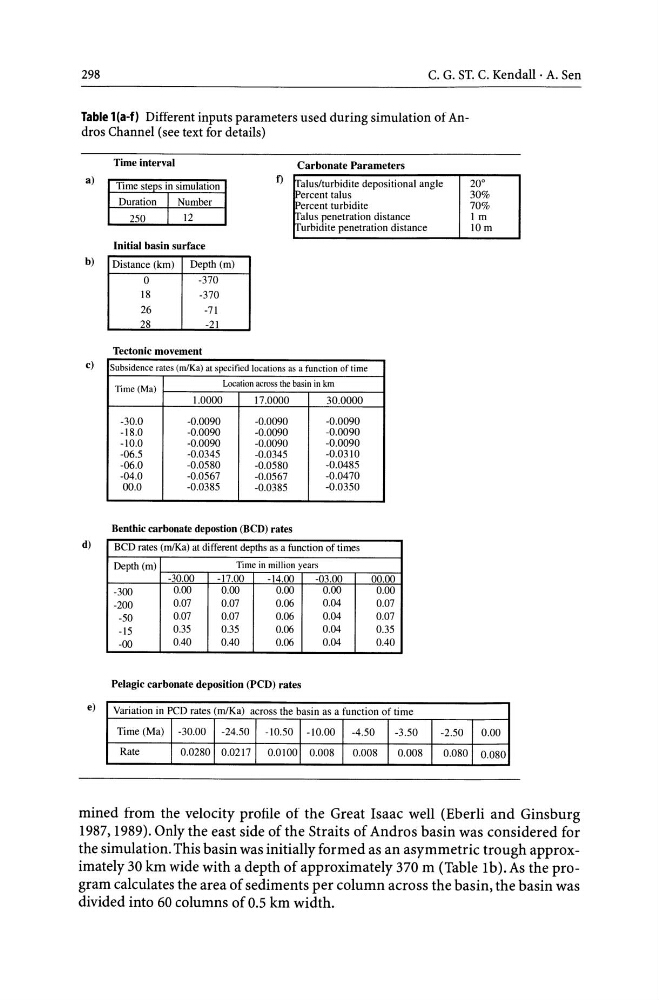
Table 1 (a-f) Different inputs parameters used during simulation of Andros Channel (see text for details)
a)
b)
c)
d)
e)
Time interval
Carbonate Parameters
Time steps in simulation
Duration I Number
1)
a1us/turbidite depositional angle
20°
30%
70%
1m
10m
Percent talus
Percent turbidite
250
I 12
a1us penetration distance
Turbidite penetration distance
Initial basin surface
Distance (km)
Depth (m)
0
-370
18
-370
26
-71
28
-21
Tectonic movement
Subsidence rates (mlKa) at specified locations as a function of time
Time (Ma)
Location across the basin in km
1.0000
17.0000
30.0000
-30.0
-0.0090
-0.0090
-0.0090
-18.0
-0.0090
-0.0090
-0.0090
-10.0
-0.0090
-0.0090
-0.0090
-06.5
-0.0345
-0.0345
-0.0310
-06.0
-0.0580
-0.0580
-0.0485
-04.0
-0.0567
-0.0567
-0.0470
00.0
-0.0385
-0.0385
-0.0350
Benthic carbonate depostion (BCD) rates
BCD rates (m/Ka) at different depths as a function of times
Depth(m)
Time in million years
-30.00
-17.00
-14.00
-03.00
00.00
-300
0.00
0.00
0.00
0.00
0.00
-200
0.07
0.07
0.06
0.04
0.07
-50
0.07
0.07
0.06
0.04
0.07
-15
0.35
0.35
0.06
0.04
0.35
-00
0.40
0.40
0.06
0.04
0.40
Pelagic carbonate deposition (PCD) rates
Variation in PCD rates (m/Ka) across the basin as a function of time
Time (Ma) -30.00
-24.50
-10.50 -10.00
-4.50
-3.50
Rate
0.0280 0.0217
0.0100 0.008
0.008
0.008
-2.50
0.00
0.080 0.080
mined from the velocity profile of the Great Isaac well (Eberli and Ginsburg
1987,1989). Only the east side of the Straits of Andros basin was considered for
the simulation. This basin was initially formed as an asymmetric trough approximately 30 km wide with a depth of approximately 370 m (Table Ib).As the program calculates the area of sediments per column across the basin, the basin was
divided into 60 columns of 0.5 km width.
C. G. ST. C. Kendall· A. Sen
Table 1 (a-f) Different inputs parameters used during simulation of Andros Channel (see text for details)
a)
b)
c)
d)
e)
Time interval
Carbonate Parameters
Time steps in simulation
Duration I Number
1)
a1us/turbidite depositional angle
20°
30%
70%
1m
10m
Percent talus
Percent turbidite
250
I 12
a1us penetration distance
Turbidite penetration distance
Initial basin surface
Distance (km)
Depth (m)
0
-370
18
-370
26
-71
28
-21
Tectonic movement
Subsidence rates (mlKa) at specified locations as a function of time
Time (Ma)
Location across the basin in km
1.0000
17.0000
30.0000
-30.0
-0.0090
-0.0090
-0.0090
-18.0
-0.0090
-0.0090
-0.0090
-10.0
-0.0090
-0.0090
-0.0090
-06.5
-0.0345
-0.0345
-0.0310
-06.0
-0.0580
-0.0580
-0.0485
-04.0
-0.0567
-0.0567
-0.0470
00.0
-0.0385
-0.0385
-0.0350
Benthic carbonate depostion (BCD) rates
BCD rates (m/Ka) at different depths as a function of times
Depth(m)
Time in million years
-30.00
-17.00
-14.00
-03.00
00.00
-300
0.00
0.00
0.00
0.00
0.00
-200
0.07
0.07
0.06
0.04
0.07
-50
0.07
0.07
0.06
0.04
0.07
-15
0.35
0.35
0.06
0.04
0.35
-00
0.40
0.40
0.06
0.04
0.40
Pelagic carbonate deposition (PCD) rates
Variation in PCD rates (m/Ka) across the basin as a function of time
Time (Ma) -30.00
-24.50
-10.50 -10.00
-4.50
-3.50
Rate
0.0280 0.0217
0.0100 0.008
0.008
0.008
-2.50
0.00
0.080 0.080
mined from the velocity profile of the Great Isaac well (Eberli and Ginsburg
1987,1989). Only the east side of the Straits of Andros basin was considered for
the simulation. This basin was initially formed as an asymmetric trough approximately 30 km wide with a depth of approximately 370 m (Table Ib).As the program calculates the area of sediments per column across the basin, the basin was
divided into 60 columns of 0.5 km width.