

Use of Sedimentary simulations for dating sequence boundaries and measuring •••
297
STAGES
Quaternary
~al'2lian
Placenzlan
3.5
EUSTATIC CURVES
250
150
50 OM
••..•...•.•.• .........
Zanclian
••••••••••••
MeS~~-ian-----t:;.;.;;-;.;;~;..;:;.;.;:;:;::~:=?~
Tortonian
10.2 -~I _ _ _ _ _ _ _ _ -",~_---'I
Serravallian
....................
La n ~l;la::n:---j'-=---=---=---=--"--'-.-=--=--=---=-~-:§-'='-$-~-:...:-:...:-:...:-=---=---=-j
ffi.2 ~----j------~==-----I
Burdigalian
20
Aquitanian
25.2 -----j.--.... -..... -...... -.- . . . . . . . . . . . . . . . . . . . . ---....................... .".--"'0---.-. I
Chattian
30
Rupelian
36
after Haq et al., 1987
3.3
Simulation Input Parameters
AGE
Ma
o
5
10
15
20
25
30
35
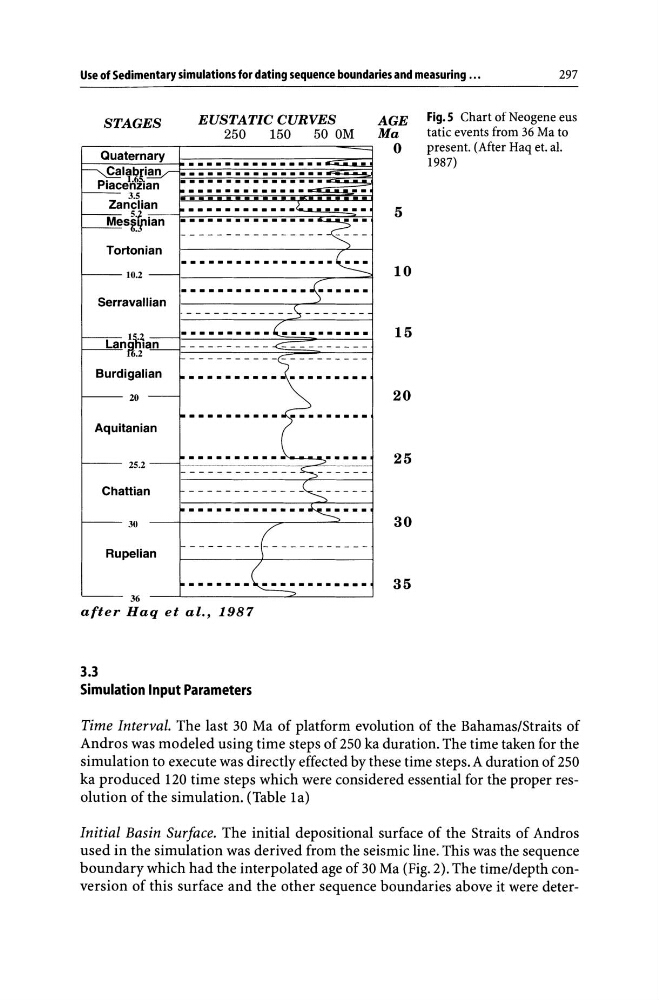
Fig.5 Chart of Neogene eus
tatic events from 36 Ma to
present. (After Haq et. al.
1987)
Time Interval. The last 30 Ma of platform evolution of the Bahamas/Straits of
Andros was modeled using time steps of 250 ka duration. The time taken for the
simulation to execute was directly effected by these time steps. A duration of 250
ka produced 120 time steps which were considered essential for the proper resolution of the simulation. (Table 1 a)
Initial Basin Surface. The initial depositional surface of the Straits of Andros
used in the simulation was derived from the seismic line. This was the sequence
boundary which had the interpolated age of 30 Ma (Fig. 2). The time/depth conversion of this surface and the other sequence boundaries above it were deter-
297
STAGES
Quaternary
~al'2lian
Placenzlan
3.5
EUSTATIC CURVES
250
150
50 OM
••..•...•.•.• .........
Zanclian
••••••••••••
MeS~~-ian-----t:;.;.;;-;.;;~;..;:;.;.;:;:;::~:=?~
Tortonian
10.2 -~I _ _ _ _ _ _ _ _ -",~_---'I
Serravallian
....................
La n ~l;la::n:---j'-=---=---=---=--"--'-.-=--=--=---=-~-:§-'='-$-~-:...:-:...:-:...:-=---=---=-j
ffi.2 ~----j------~==-----I
Burdigalian
20
Aquitanian
25.2 -----j.--.... -..... -...... -.- . . . . . . . . . . . . . . . . . . . . ---....................... .".--"'0---.-. I
Chattian
30
Rupelian
36
after Haq et al., 1987
3.3
Simulation Input Parameters
AGE
Ma
o
5
10
15
20
25
30
35
Fig.5 Chart of Neogene eus
tatic events from 36 Ma to
present. (After Haq et. al.
1987)
Time Interval. The last 30 Ma of platform evolution of the Bahamas/Straits of
Andros was modeled using time steps of 250 ka duration. The time taken for the
simulation to execute was directly effected by these time steps. A duration of 250
ka produced 120 time steps which were considered essential for the proper resolution of the simulation. (Table 1 a)
Initial Basin Surface. The initial depositional surface of the Straits of Andros
used in the simulation was derived from the seismic line. This was the sequence
boundary which had the interpolated age of 30 Ma (Fig. 2). The time/depth conversion of this surface and the other sequence boundaries above it were deter-