

282
L. Ainsaar, T. Martma, T. Meidla, M. Rubel and N. SidaraviCiene
Table 1 Processings of distributional data of 255 ostracode species
from 50 sections according to three different strategies. The strategy
100 prefers the species occurring in the highest number of sections
(= frequency), strategy 1 gives no preferences based on frequency.
Ranges are determined by number of successive unitary associations (rows of range charts)
Processing
2
3
Strategy
100
10
Scaled species
84
95
97
Datum planes
35
40
44
Mean frequency
14.202
9.705
8.06
Mean range
5.679
4.232
4.43
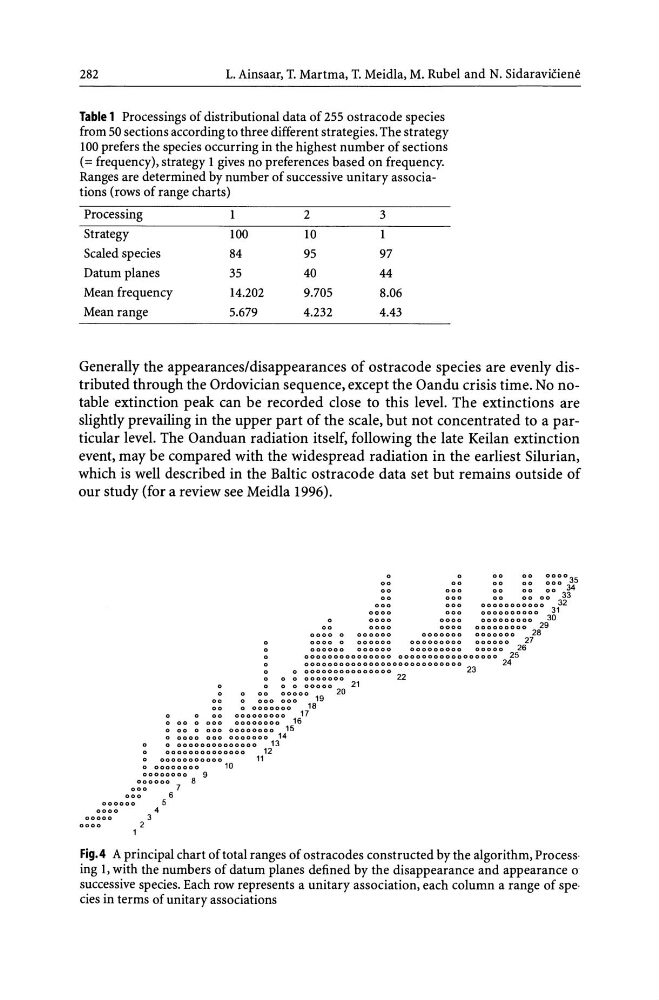
Generally the appearances/disappearances of ostracode species are evenly distributed through the Ordovician sequence, except the Oandu crisis time. No notable extinction peak can be recorded close to this level. The extinctions are
slightly prevailing in the upper part of the scale, but not concentrated to a particular level. The Oanduan radiation itself, following the late Keilan extinction
event, may be compared with the widespread radiation in the earliest Silurian,
which is well described in the Baltic ostracode data set but remains outside of
our study (for a review see Meidla 1996).
0000 0
0000 0
00
00
00
000000
000000
000000
000000000000000
o
00
000
000
:~
~~ ~~~o~5
00
00 00
33
00000000000 3132
0000000000
3D
000000000
29
000:::: 000000000 28
27
000000000
00000
26
00000000000000000
25
000000000000000000000000000
24
o 000000000000000
23
o 0
o
0
0
00000
21
o
00
00000
20
DC)
000
19
~~ o:o:::::~o 1iB
o 000
00000000
16
00 0
000 00000000
15
0000 000 0000000
14
o 00000000000000
13
00000000000000
12
00000000000
11
o 00000000
10
000000
000
7
DOD
6
000000
5
0000
4
00000
3
0000
2
1
22
Fig.4 A principal chart of total ranges of ostracodes constructed by the algorithm, Process·
ing 1, with the numbers of datum planes defined by the disappearance and appearance 0
successive species. Each row represents a unitary association, each column a range of spe·
cies in terms of unitary associations
L. Ainsaar, T. Martma, T. Meidla, M. Rubel and N. SidaraviCiene
Table 1 Processings of distributional data of 255 ostracode species
from 50 sections according to three different strategies. The strategy
100 prefers the species occurring in the highest number of sections
(= frequency), strategy 1 gives no preferences based on frequency.
Ranges are determined by number of successive unitary associations (rows of range charts)
Processing
2
3
Strategy
100
10
Scaled species
84
95
97
Datum planes
35
40
44
Mean frequency
14.202
9.705
8.06
Mean range
5.679
4.232
4.43
Generally the appearances/disappearances of ostracode species are evenly distributed through the Ordovician sequence, except the Oandu crisis time. No notable extinction peak can be recorded close to this level. The extinctions are
slightly prevailing in the upper part of the scale, but not concentrated to a particular level. The Oanduan radiation itself, following the late Keilan extinction
event, may be compared with the widespread radiation in the earliest Silurian,
which is well described in the Baltic ostracode data set but remains outside of
our study (for a review see Meidla 1996).
0000 0
0000 0
00
00
00
000000
000000
000000
000000000000000
o
00
000
000
:~
~~ ~~~o~5
00
00 00
33
00000000000 3132
0000000000
3D
000000000
29
000:::: 000000000 28
27
000000000
00000
26
00000000000000000
25
000000000000000000000000000
24
o 000000000000000
23
o 0
o
0
0
00000
21
o
00
00000
20
DC)
000
19
~~ o:o:::::~o 1iB
o 000
00000000
16
00 0
000 00000000
15
0000 000 0000000
14
o 00000000000000
13
00000000000000
12
00000000000
11
o 00000000
10
000000
000
7
DOD
6
000000
5
0000
4
00000
3
0000
2
1
22
Fig.4 A principal chart of total ranges of ostracodes constructed by the algorithm, Process·
ing 1, with the numbers of datum planes defined by the disappearance and appearance 0
successive species. Each row represents a unitary association, each column a range of spe·
cies in terms of unitary associations