

248
W. Schwarzacher
priori that sequences are synchronous worldwide, and it is also difficult to recognise sequence boundaries when they are removed from the margins of basins.
2
Sequences
Although sequences can be defined without any reference to actual processes,
they are nevertheless always connected with relative sea-level fluctuations. The
compilation of sequences from all over the world has led to the construction of
a eustatic sea-level curve for the Mesozoic and Cenozoic (Haq et al. 1987). The
curve provides data on the frequency and, to a lesser degree, also on the magnitude of sea level changes. The latter is estimated from the relative change of
coastal onlap. Based on the magnitude of changes, three orders of cycles have
been differentiated. The shortest fluctuation, which is called the third-order cycle, is grouped into supercycles or cycles of second order, and these form into
even longer megacycles and megacycle sets, which together constitute the first
order cycles. Third-order cycles are documented by definite sequence boundaries, but the existence of slower fluctuations relies entirely on the magnitude of
sea level changes, which are very difficult to estimate quantitatively. The data in
the chart do not show any fixed ratio between 3rd-and 2nd-order cycles and the
number of short cycles within a 2nd-order cycle may vary from 2 to 9. The duration of the second-order cycles is also highly variable with a mean of 8 Ma.
This high variability is reflected in the classification of cycles according to duration, which is given as 0.5 to 3 Ma for the third-order cycles, 3- 50 Ma for the second order cycles and 50+ Ma for the first order cycles.
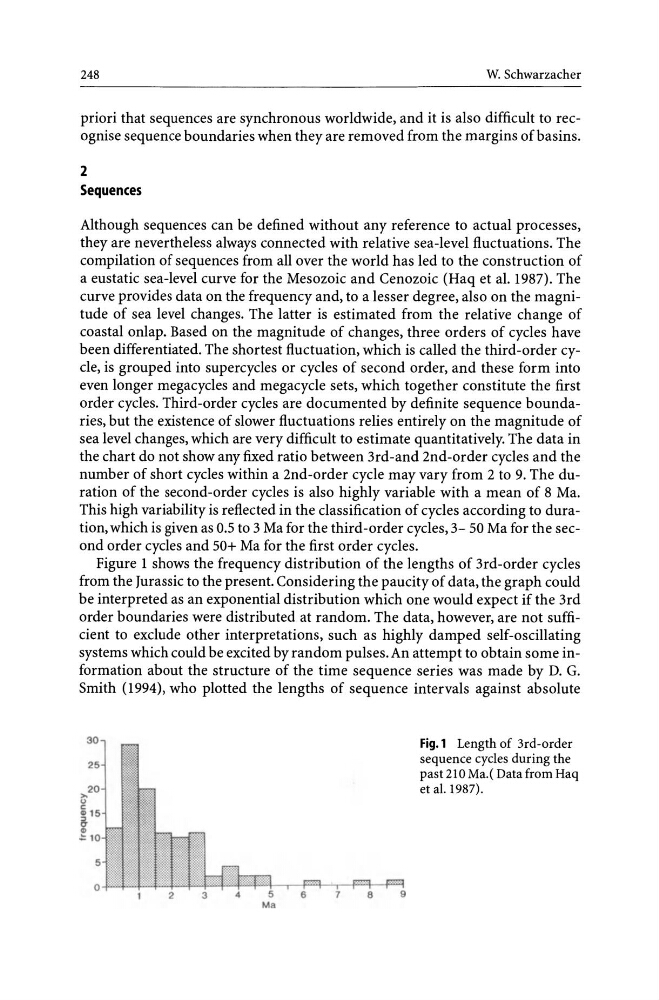
Figure 1 shows the frequency distribution of the lengths of 3rd-order cycles
from the Jurassic to the present. Considering the paucity of data, the graph could
be interpreted as an exponential distribution which one would expect if the 3rd
order boundaries were distributed at random. The data, however, are not sufficient to exclude other interpretations, such as highly damped self-oscillating
systems which could be excited by random pulses. An attempt to obtain some information about the structure of the time sequence series was made by D. G.
Smith (1994), who plotted the lengths of sequence intervals against absolute
25
20
,.,
u
c:
""5
&
"'
.::\
2
3
4
5
Ma
8
9
Fig.l Length of 3rd-order
sequence cycles during the
past210 Ma.( Data from Haq
et al. 1987).
W. Schwarzacher
priori that sequences are synchronous worldwide, and it is also difficult to recognise sequence boundaries when they are removed from the margins of basins.
2
Sequences
Although sequences can be defined without any reference to actual processes,
they are nevertheless always connected with relative sea-level fluctuations. The
compilation of sequences from all over the world has led to the construction of
a eustatic sea-level curve for the Mesozoic and Cenozoic (Haq et al. 1987). The
curve provides data on the frequency and, to a lesser degree, also on the magnitude of sea level changes. The latter is estimated from the relative change of
coastal onlap. Based on the magnitude of changes, three orders of cycles have
been differentiated. The shortest fluctuation, which is called the third-order cycle, is grouped into supercycles or cycles of second order, and these form into
even longer megacycles and megacycle sets, which together constitute the first
order cycles. Third-order cycles are documented by definite sequence boundaries, but the existence of slower fluctuations relies entirely on the magnitude of
sea level changes, which are very difficult to estimate quantitatively. The data in
the chart do not show any fixed ratio between 3rd-and 2nd-order cycles and the
number of short cycles within a 2nd-order cycle may vary from 2 to 9. The duration of the second-order cycles is also highly variable with a mean of 8 Ma.
This high variability is reflected in the classification of cycles according to duration, which is given as 0.5 to 3 Ma for the third-order cycles, 3- 50 Ma for the second order cycles and 50+ Ma for the first order cycles.
Figure 1 shows the frequency distribution of the lengths of 3rd-order cycles
from the Jurassic to the present. Considering the paucity of data, the graph could
be interpreted as an exponential distribution which one would expect if the 3rd
order boundaries were distributed at random. The data, however, are not sufficient to exclude other interpretations, such as highly damped self-oscillating
systems which could be excited by random pulses. An attempt to obtain some information about the structure of the time sequence series was made by D. G.
Smith (1994), who plotted the lengths of sequence intervals against absolute
25
20
,.,
u
c:
""5
&
"'
.::\
2
3
4
5
Ma
8
9
Fig.l Length of 3rd-order
sequence cycles during the
past210 Ma.( Data from Haq
et al. 1987).