

Field and Numerical Studies of Near-Bed Aggregate Dynamics
.. >
.8 40cm
..
~ 20 an
.,
:I:
POe
IPg dm 3)
Chlorophyll eqUivalenls
11'9 dm 3)
Rahool POC
Chlorophyll eqUIV
185
'''e-amlno aad utllaz8uon
[ngPd I)
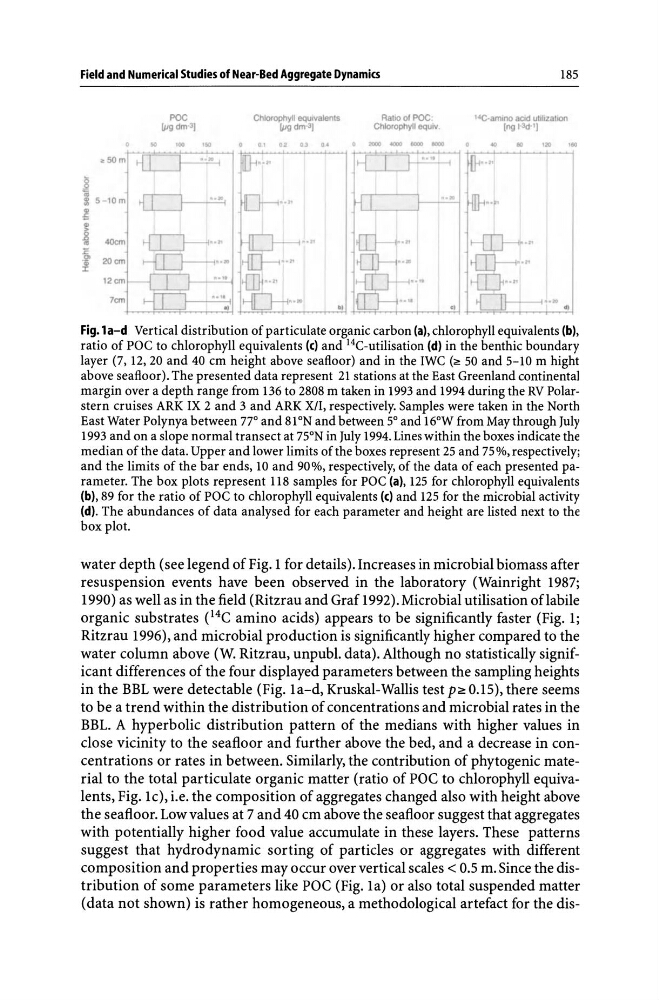
Fig. 1 a-d Vertical distribution of particulate organic carbon (a), chlorophyll equivalents (b),
ratio of POC to chlorophyll equivalents (c) and 14C-utilisation (d) in the benthic boundary
layer (7, 12,20 and 40 cm height above seafloor) and in the IWC (~ 50 and 5-10 m hight
above seafloor). The presented data represent 21 stations at the East Greenland continental
margin over a depth range from 136 to 2808 m taken in 1993 and 1994 during the RV Polarstern cruises ARK IX 2 and 3 and ARK XII, respectively. Samples were taken in the North
East Water Polynya between 77° and 81 ON and between 5° and 16°W from May through July
1993 and on a slope normal transect at 75°N in July 1994. Lines within the boxes indicate the
median of the data. Upper and lower limits of the boxes represent 25 and 75%, respectively;
and the limits of the bar ends, 10 and 90%, respectively, of the data of each presented parameter. The box plots represent 118 samples for POC (a), 125 for chlorophyll equivalents
(b), 89 for the ratio of POC to chlorophyll equivalents (c) and 125 for the microbial activity
(d). The abundances of data analysed for each parameter and height are listed next to the
box plot.
water depth (see legend of Fig. 1 for details). Increases in microbial biomass after
resuspension events have been observed in the laboratory (Wainright 1987;
1990) as well as in the field (Ritzrau and Graf 1992). Microbial utilisation oflabile
organic substrates e 4 e amino acids) appears to be significantly faster (Fig. 1;
Ritzrau 1996), and microbial production is significantly higher compared to the
water column above (W. Ritzrau, unpubl. data). Although no statistically significant differences of the four displayed parameters between the sampling heights
in the BBL were detectable (Fig. 1a-d, Kruskal-Wallis test p' to be a trend within the distribution of concentrations and microbial rates in the
BBL. A hyperbolic distribution pattern of the medians with higher values in
close vicinity to the seafloor and further above the bed, and a decrease in concentrations or rates in between. Similarly, the contribution of phytogenic material to the total particulate organic matter (ratio of poe to chlorophyll equivalents, Fig. 1c), i.e. the composition of aggregates changed also with height above
the seafloor. Low values at 7 and 40 cm above the seafloor suggest that aggregates
with potentially higher food value accumulate in these layers. These patterns
suggest that hydrodynamic sorting of particles or aggregates with different
composition and properties may occur over vertical scales < 0.5 m. Since the distribution of some parameters like poe (Fig. 1a) or also total suspended matter
(data not shown) is rather homogeneous, a methodological artefact for the dis-
.. >
.8 40cm
..
~ 20 an
.,
:I:
POe
IPg dm 3)
Chlorophyll eqUivalenls
11'9 dm 3)
Rahool POC
Chlorophyll eqUIV
185
'''e-amlno aad utllaz8uon
[ngPd I)
Fig. 1 a-d Vertical distribution of particulate organic carbon (a), chlorophyll equivalents (b),
ratio of POC to chlorophyll equivalents (c) and 14C-utilisation (d) in the benthic boundary
layer (7, 12,20 and 40 cm height above seafloor) and in the IWC (~ 50 and 5-10 m hight
above seafloor). The presented data represent 21 stations at the East Greenland continental
margin over a depth range from 136 to 2808 m taken in 1993 and 1994 during the RV Polarstern cruises ARK IX 2 and 3 and ARK XII, respectively. Samples were taken in the North
East Water Polynya between 77° and 81 ON and between 5° and 16°W from May through July
1993 and on a slope normal transect at 75°N in July 1994. Lines within the boxes indicate the
median of the data. Upper and lower limits of the boxes represent 25 and 75%, respectively;
and the limits of the bar ends, 10 and 90%, respectively, of the data of each presented parameter. The box plots represent 118 samples for POC (a), 125 for chlorophyll equivalents
(b), 89 for the ratio of POC to chlorophyll equivalents (c) and 125 for the microbial activity
(d). The abundances of data analysed for each parameter and height are listed next to the
box plot.
water depth (see legend of Fig. 1 for details). Increases in microbial biomass after
resuspension events have been observed in the laboratory (Wainright 1987;
1990) as well as in the field (Ritzrau and Graf 1992). Microbial utilisation oflabile
organic substrates e 4 e amino acids) appears to be significantly faster (Fig. 1;
Ritzrau 1996), and microbial production is significantly higher compared to the
water column above (W. Ritzrau, unpubl. data). Although no statistically significant differences of the four displayed parameters between the sampling heights
in the BBL were detectable (Fig. 1a-d, Kruskal-Wallis test p' to be a trend within the distribution of concentrations and microbial rates in the
BBL. A hyperbolic distribution pattern of the medians with higher values in
close vicinity to the seafloor and further above the bed, and a decrease in concentrations or rates in between. Similarly, the contribution of phytogenic material to the total particulate organic matter (ratio of poe to chlorophyll equivalents, Fig. 1c), i.e. the composition of aggregates changed also with height above
the seafloor. Low values at 7 and 40 cm above the seafloor suggest that aggregates
with potentially higher food value accumulate in these layers. These patterns
suggest that hydrodynamic sorting of particles or aggregates with different
composition and properties may occur over vertical scales < 0.5 m. Since the distribution of some parameters like poe (Fig. 1a) or also total suspended matter
(data not shown) is rather homogeneous, a methodological artefact for the dis-