

A Coupled Physical-Chemica I-Biological Model for the Western Baltic
175
crease the concentrations of phytoplankton for a few days, e.g. 21.5.1994 at station 113 and 18.5.1995 at station 213.
Timing, duration and maximum values of the blooms differ regionally and interannually. There is a regional delay in timing of the bloom. It starts in the shallow regions of the model area like Greifswalder Bodden and nearshore regions,
where the phytoplankton cannot leave the euphotic zone by sinking and hence
the formation of thermocline is not necessary to satisfy the Sverdrup criterion.
Later, in response to solar heating, a thermocline develops in the deeper basins
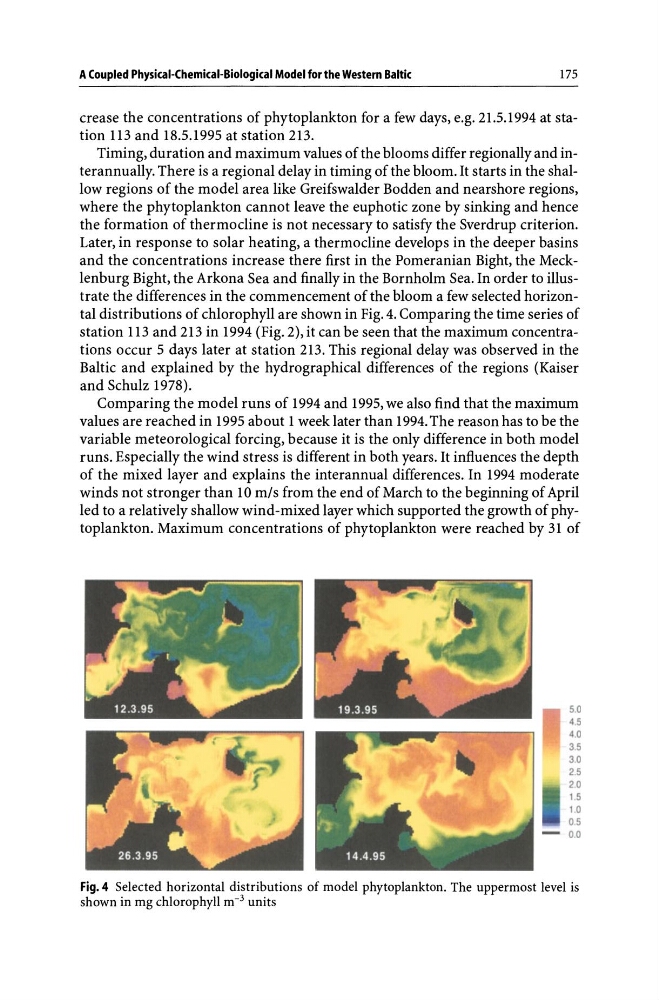
and the concentrations increase there first in the Pomeranian Bight, the Mecklenburg Bight, the Arkona Sea and finally in the Bornholm Sea. In order to illustrate the differences in the commencement of the bloom a few selected horizontal distributions of chlorophyll are shown in Fig. 4. Comparing the time series of
station 113 and 213 in 1994 (Fig. 2), it can be seen that the maximum concentrations occur 5 days later at station 213. This regional delay was observed in the
Baltic and explained by the hydrographical differences of the regions (Kaiser
and Schulz 1978).
Comparing the model runs of 1994 and 1995, we also find that the maximum
values are reached in 1995 about 1 week later than 1994. The reason has to be the
variable meteorological forcing, because it is the only difference in both model
runs. Especially the wind stress is different in both years. It influences the depth
of the mixed layer and explains the interannual differences. In 1994 moderate
winds not stronger than 10 m/s from the end of March to the beginning of April
led to a relatively shallow wind-mixed layer which supported the growth of phytoplankton. Maximum concentrations of phytoplankton were reached by 31 of
50
4.5
4,0
35
3.0
2.5
20
1.5
10
0.5
0.0
Fig.4 Selected horizontal distributions of model phytoplankton. The uppermost level is
shown in mg chlorophyll m- 3 units
175
crease the concentrations of phytoplankton for a few days, e.g. 21.5.1994 at station 113 and 18.5.1995 at station 213.
Timing, duration and maximum values of the blooms differ regionally and interannually. There is a regional delay in timing of the bloom. It starts in the shallow regions of the model area like Greifswalder Bodden and nearshore regions,
where the phytoplankton cannot leave the euphotic zone by sinking and hence
the formation of thermocline is not necessary to satisfy the Sverdrup criterion.
Later, in response to solar heating, a thermocline develops in the deeper basins
and the concentrations increase there first in the Pomeranian Bight, the Mecklenburg Bight, the Arkona Sea and finally in the Bornholm Sea. In order to illustrate the differences in the commencement of the bloom a few selected horizontal distributions of chlorophyll are shown in Fig. 4. Comparing the time series of
station 113 and 213 in 1994 (Fig. 2), it can be seen that the maximum concentrations occur 5 days later at station 213. This regional delay was observed in the
Baltic and explained by the hydrographical differences of the regions (Kaiser
and Schulz 1978).
Comparing the model runs of 1994 and 1995, we also find that the maximum
values are reached in 1995 about 1 week later than 1994. The reason has to be the
variable meteorological forcing, because it is the only difference in both model
runs. Especially the wind stress is different in both years. It influences the depth
of the mixed layer and explains the interannual differences. In 1994 moderate
winds not stronger than 10 m/s from the end of March to the beginning of April
led to a relatively shallow wind-mixed layer which supported the growth of phytoplankton. Maximum concentrations of phytoplankton were reached by 31 of
50
4.5
4,0
35
3.0
2.5
20
1.5
10
0.5
0.0
Fig.4 Selected horizontal distributions of model phytoplankton. The uppermost level is
shown in mg chlorophyll m- 3 units