

SEDLOB and PAlLOB
1.8r=~'~'_~'~----~--~~==~==~==~
"1.6
. :-....:..---.:.. '-.:. ~
1.4
1.2 ~ . . . . . . . .
1.0
'4
..
0.8
"
0 .6
"
••
••
004
O.
02
•• ... '"
; ......
. .
-+. ~ . -+1 ... nl')
I • 1x190)A2 • SIgn I.)
I • 1x190)A4 • sign I.)
-+- 1 ,.b.I.V90jAO 5 • $Ign'.)
_
I· Ilb.lxV90l"O 25 • Sl9nl.)
1 . Ilbs(xIl90)A(lIB) • sign I')
I • Ilbo,xl/gOjAl 11161 • sign Ix)
." .
., .............
-.... . · 0 - ~. -.
0 . 2-r-r-'-'~~--r-~~~~~~-r-T~~
-2.0 -1 .5 -1. 0 -0.5 0.0 0.5
1.0 1.5 2.0
downward -t- bottom slope [0] --+ upward
123
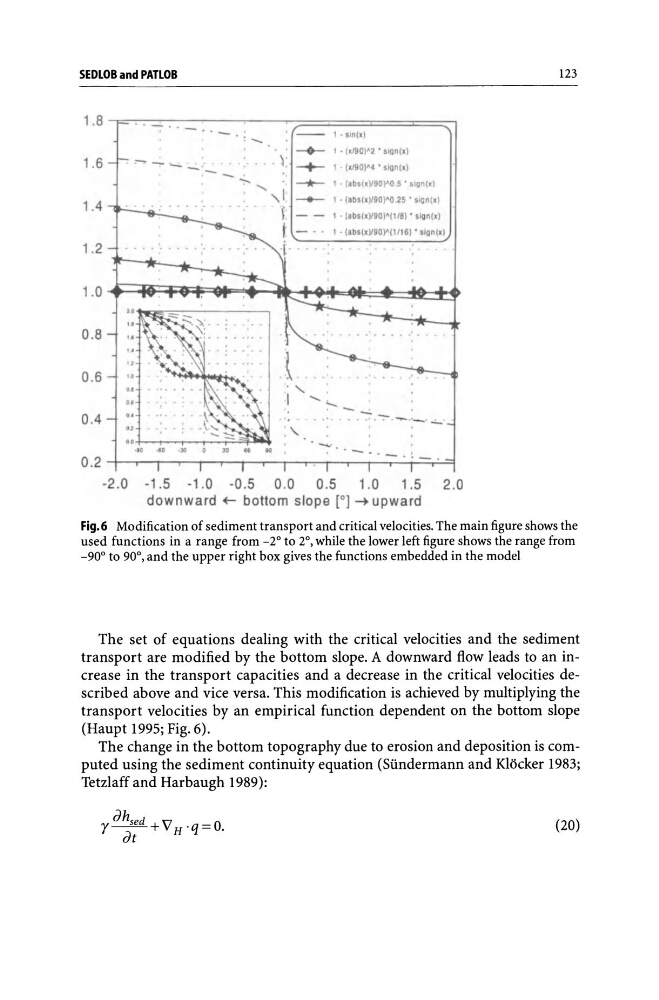
Fig.6 Modification of sediment transport and critical velocities. The main figure shows the
used functions in a range from _2° to 2°, while the lower left figure shows the range from
-90° to 90°, and the upper right box gives the functions embedded in the model
The set of equations dealing with the critical velocities and the sediment
transport are modified by the bottom slope. A downward flow leads to an increase in the transport capacities and a decrease in the critical velocities described above and vice versa. This modification is achieved by multiplying the
transport velocities by an empirical function dependent on the bottom slope
(Haupt 1995; Fig. 6).
The change in the bottom topography due to erosion and deposition is computed using the sediment continuity equation (Siindermann and Klocker 1983;
Tetzlaff and Harbaugh 1989):
(20)
1.8r=~'~'_~'~----~--~~==~==~==~
"1.6
. :-....:..---.:.. '-.:. ~
1.4
1.2 ~ . . . . . . . .
1.0
'4
..
0.8
"
0 .6
"
••
••
004
O.
02
•• ... '"
; ......
. .
-+. ~ . -+1 ... nl')
I • 1x190)A2 • SIgn I.)
I • 1x190)A4 • sign I.)
-+- 1 ,.b.I.V90jAO 5 • $Ign'.)
_
I· Ilb.lxV90l"O 25 • Sl9nl.)
1 . Ilbs(xIl90)A(lIB) • sign I')
I • Ilbo,xl/gOjAl 11161 • sign Ix)
." .
., .............
-.... . · 0 - ~. -.
0 . 2-r-r-'-'~~--r-~~~~~~-r-T~~
-2.0 -1 .5 -1. 0 -0.5 0.0 0.5
1.0 1.5 2.0
downward -t- bottom slope [0] --+ upward
123
Fig.6 Modification of sediment transport and critical velocities. The main figure shows the
used functions in a range from _2° to 2°, while the lower left figure shows the range from
-90° to 90°, and the upper right box gives the functions embedded in the model
The set of equations dealing with the critical velocities and the sediment
transport are modified by the bottom slope. A downward flow leads to an increase in the transport capacities and a decrease in the critical velocities described above and vice versa. This modification is achieved by multiplying the
transport velocities by an empirical function dependent on the bottom slope
(Haupt 1995; Fig. 6).
The change in the bottom topography due to erosion and deposition is computed using the sediment continuity equation (Siindermann and Klocker 1983;
Tetzlaff and Harbaugh 1989):
(20)