

11.5 Clastic Sediment, Distribution
527
90° a
60°
20°
150°
120°
5000
ctI
-- .....
b
TRANSFER RATIO (%)
10 20
50 100
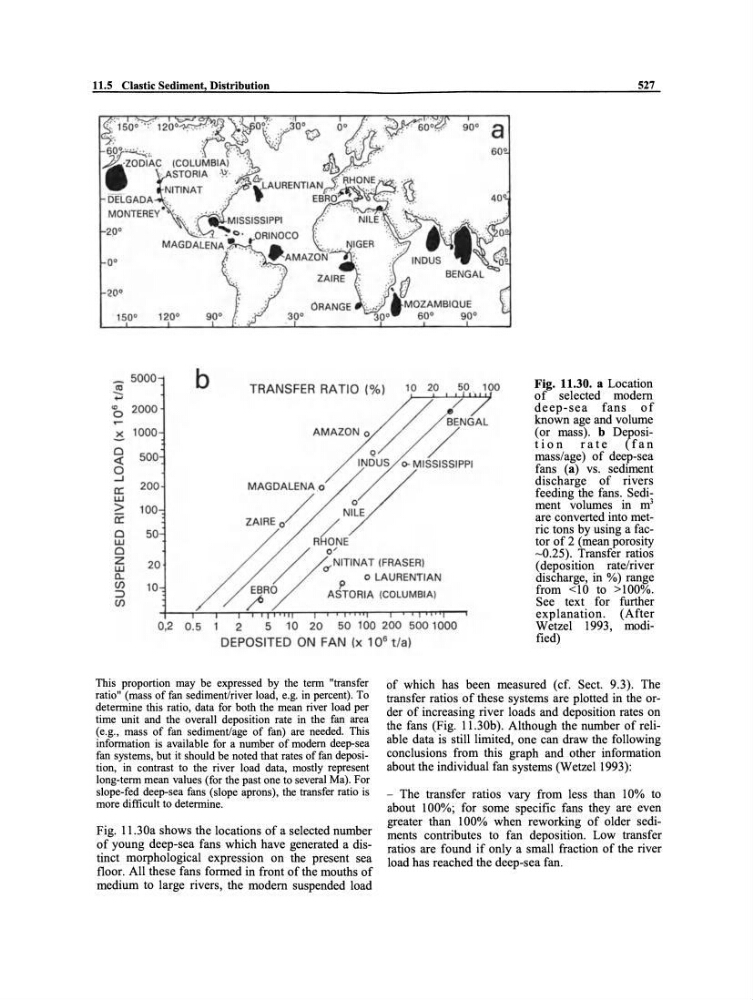
Fig. 11.30. a Location
of selected modem
deep-sea fans of
known age and volume
(or mass). b Deposition rate (fan
mass/age) of deep-sea
fans (a) vs. sediment
discharge of rivers
feeding the fans. Sediment volumes in m 3
are converted into metric tons by using a factor of 2 (mean porosity
-0.25). Transfer ratios
(deposition rate/river
discharge, in %) range
from <10 to >100%.
See text for further
explanation. (After
Wetzel 1993, modified)
Ö 2000
/
/
BENGAL
~ 1000
o
«
o ..J
500
AMAZONO o
/
/
/
INDUS 0- MISSISSIPPI
a::
w
>
1i:
o
w
o
z w
a...
(J)
200
100
50
MAGDALENA .o
~
/
NILE
ZAIRE o/
/ /
RHONE
=> (J)
20
10
/
/
0 LAURENTIAN
V
;~ITINAT {FRASER)
,RO
AtTORIA (COLUMBlA)
0,2 0.5 1 2
5 ' 10 20 50 100 200 5001000
DEPOSITED ON FAN (x 10 6 t/a)
This proportion may be expressed by the term "transfer
ratio" (mass of fan sedimentJriver load, e.g. in percent). To
determine this ratio, data for both the mean river load per
time unit and the overall deposition rate in the fan area
(e.g., rnass of fan sedimentJage of fan) are needed. This
information is available for a number of modem deep-sea
fan systems, but it should be noted that rates of fan deposition, in contrast to the river load data, mostly represent
long-term mean values (for the past one to several Ma). For
slope-fed deep-sea fans (slope aprons), the transfer ratio is
more difficult to determine.
Fig. 11.30a shows the 10cations of aselected number
of young deep-sea fans which have generated a distinct morphological expression on the present sea
floor. All these fans formed in front of the mouths of
medium to large rivers, the modem suspended load
of which has been measured (cf. Sect. 9.3). The
transfer ratios of these systems are plotted in the order of increasing river loads and deposition rates on
the fans (Fig. 11.30b). Although the number of reliable data is still limited, one can draw the following
conclusions from this graph and other information
about the individual fan systems (Wetzell993):
- The transfer ratios vary from less than 10% to
about lOO%; for some specific fans they are even
greater than lOO% when reworking of older sediments contributes to fan deposition. Low transfer
ratios are found if only a small fraction of the river
load has reached the deep-sea fan.
527
90° a
60°
20°
150°
120°
5000
ctI
-- .....
b
TRANSFER RATIO (%)
10 20
50 100
Fig. 11.30. a Location
of selected modem
deep-sea fans of
known age and volume
(or mass). b Deposition rate (fan
mass/age) of deep-sea
fans (a) vs. sediment
discharge of rivers
feeding the fans. Sediment volumes in m 3
are converted into metric tons by using a factor of 2 (mean porosity
-0.25). Transfer ratios
(deposition rate/river
discharge, in %) range
from <10 to >100%.
See text for further
explanation. (After
Wetzel 1993, modified)
Ö 2000
/
/
BENGAL
~ 1000
o
«
o ..J
500
AMAZONO o
/
/
/
INDUS 0- MISSISSIPPI
a::
w
>
1i:
o
w
o
z w
a...
(J)
200
100
50
MAGDALENA .o
~
/
NILE
ZAIRE o/
/ /
RHONE
=> (J)
20
10
/
/
0 LAURENTIAN
V
;~ITINAT {FRASER)
,RO
AtTORIA (COLUMBlA)
0,2 0.5 1 2
5 ' 10 20 50 100 200 5001000
DEPOSITED ON FAN (x 10 6 t/a)
This proportion may be expressed by the term "transfer
ratio" (mass of fan sedimentJriver load, e.g. in percent). To
determine this ratio, data for both the mean river load per
time unit and the overall deposition rate in the fan area
(e.g., rnass of fan sedimentJage of fan) are needed. This
information is available for a number of modem deep-sea
fan systems, but it should be noted that rates of fan deposition, in contrast to the river load data, mostly represent
long-term mean values (for the past one to several Ma). For
slope-fed deep-sea fans (slope aprons), the transfer ratio is
more difficult to determine.
Fig. 11.30a shows the 10cations of aselected number
of young deep-sea fans which have generated a distinct morphological expression on the present sea
floor. All these fans formed in front of the mouths of
medium to large rivers, the modem suspended load
of which has been measured (cf. Sect. 9.3). The
transfer ratios of these systems are plotted in the order of increasing river loads and deposition rates on
the fans (Fig. 11.30b). Although the number of reliable data is still limited, one can draw the following
conclusions from this graph and other information
about the individual fan systems (Wetzell993):
- The transfer ratios vary from less than 10% to
about lOO%; for some specific fans they are even
greater than lOO% when reworking of older sediments contributes to fan deposition. Low transfer
ratios are found if only a small fraction of the river
load has reached the deep-sea fan.