

496
Chapter 11 Sediment Supply, Subsidence, and Basin Fill
SEDIMENTATION RATE
CONST ANT (20 rn/Mal
VARYING
SUBSIDENCE RATE
VARYING
b
CONSTANT (50 rn/Mal d
10
20
30
40 Ma
0,---~~~--~~--~4
o
o~-.~--~----~--~~
40 Ma
10
20
30
2
km
MARINE
SEDIMENT
20 m/Ma
c
30
40 Ma
20
o
O~~--~~~ -~~"~~--~----~~
S1~~~;~::;\, 20
CONTINENTAL ;;;"
100 "<:>" ~~
MARINE BA~: i~; : ;
F~ä-o
km
2
km
RATES VALID FOR
CENTRAL PART OF BASIN
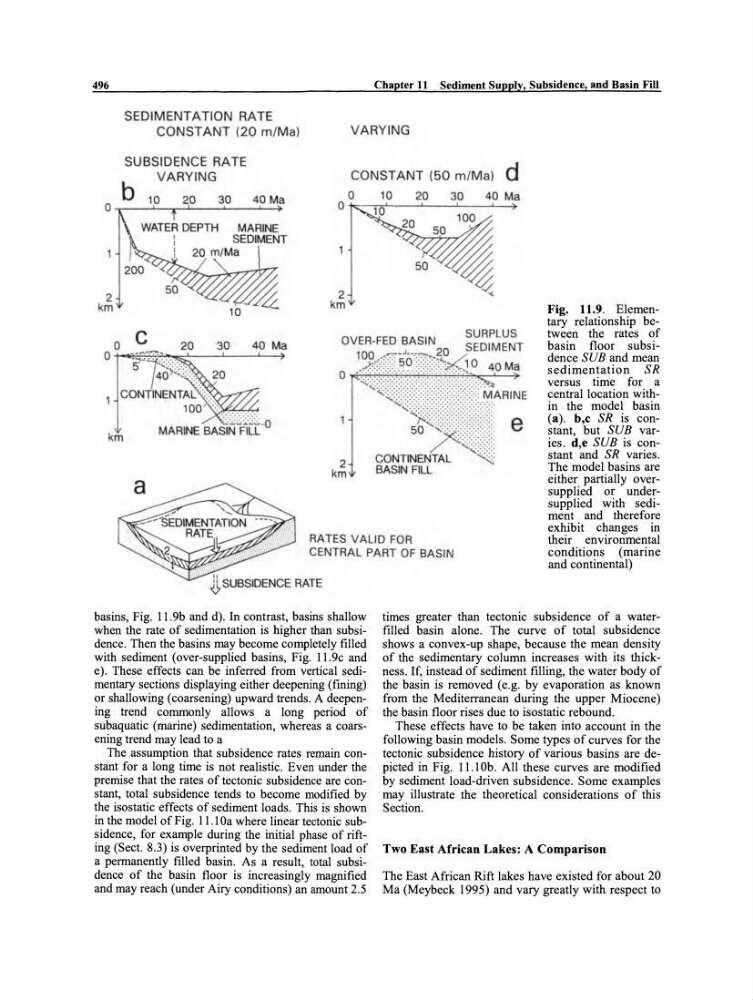
Fig. 11.9. Elementary relationship between the rates of
basin floor subsidence SUB and mean
sedimentation SR
versus time for a
central location within the model basin
(a). b,c SR is constant, but SUB varies. d,e SUB is constant and SR varies.
The model basins are
either partially oversupplied or undersupplied with sediment and therefore
exhibit changes in
their environmental
conditions (marine
and continental)
basins, Fig. 11.9b and d). In contrast, basins shallow
when the rate of sedimentation is higher than subsidence. Then the basins may become completely filled
with sediment (over-supplied basins, Fig. 11.9c and
e). These effects can be inferred from vertical sedimentary sections displaying either deepening (fining)
or shallowing (coarsening) upward trends. A deepening trend commonly allows a long period of
subaquatic (marine) sedimentation, whereas a coarsening trend may lead to a
The assumption that subsidence rates remain constant for a long time is not realistic. Even under the
premise that the rates of tectonic subsidence are constant, total subsidence tends to become modified by
the isostatic effects of sediment loads. This is shown
in the model of Fig. 11.10a where linear tectonic subsidence, for example during the initial phase of rifting (Sect. 8.3) is overprinted by the sediment load of
a permanently filled basin. As a result, total subsidence of the basin floor is increasingly magnified
and may reach (under Airy conditions) an amount 2.5
times greater than tectonic subsidence of a waterfilled basin alone. The curve of total subsidence
shows a convex-up shape, because the mean density
of the sedimentary colurnn increases with its thickness. If, instead of sediment filling, the water body of
the basin is removed (e.g. by evaporation as known
from the Mediterranean during the upper Miocene)
the basin floor rises due to isostatic rebound.
These effects have to be taken into account in the
following basin models. Some types of curves for the
tectonic subsidence history of various basins are depicted in Fig. 11.10b. All these curves are modified
by sediment load-driven subsidence. Some examples
may illustrate the theoretical considerations of this
Section.
Two East African Lakes: A Comparison
The East African Rift lakes have existed for about 20
Ma (Meybeck 1995) and vary greatly with respect to
Chapter 11 Sediment Supply, Subsidence, and Basin Fill
SEDIMENTATION RATE
CONST ANT (20 rn/Mal
VARYING
SUBSIDENCE RATE
VARYING
b
CONSTANT (50 rn/Mal d
10
20
30
40 Ma
0,---~~~--~~--~4
o
o~-.~--~----~--~~
40 Ma
10
20
30
2
km
MARINE
SEDIMENT
20 m/Ma
c
30
40 Ma
20
o
O~~--~~~ -~~"~~--~----~~
S1~~~;~::;\, 20
CONTINENTAL ;;;"
100 "<:>" ~~
MARINE BA~: i~; : ;
F~ä-o
km
2
km
RATES VALID FOR
CENTRAL PART OF BASIN
Fig. 11.9. Elementary relationship between the rates of
basin floor subsidence SUB and mean
sedimentation SR
versus time for a
central location within the model basin
(a). b,c SR is constant, but SUB varies. d,e SUB is constant and SR varies.
The model basins are
either partially oversupplied or undersupplied with sediment and therefore
exhibit changes in
their environmental
conditions (marine
and continental)
basins, Fig. 11.9b and d). In contrast, basins shallow
when the rate of sedimentation is higher than subsidence. Then the basins may become completely filled
with sediment (over-supplied basins, Fig. 11.9c and
e). These effects can be inferred from vertical sedimentary sections displaying either deepening (fining)
or shallowing (coarsening) upward trends. A deepening trend commonly allows a long period of
subaquatic (marine) sedimentation, whereas a coarsening trend may lead to a
The assumption that subsidence rates remain constant for a long time is not realistic. Even under the
premise that the rates of tectonic subsidence are constant, total subsidence tends to become modified by
the isostatic effects of sediment loads. This is shown
in the model of Fig. 11.10a where linear tectonic subsidence, for example during the initial phase of rifting (Sect. 8.3) is overprinted by the sediment load of
a permanently filled basin. As a result, total subsidence of the basin floor is increasingly magnified
and may reach (under Airy conditions) an amount 2.5
times greater than tectonic subsidence of a waterfilled basin alone. The curve of total subsidence
shows a convex-up shape, because the mean density
of the sedimentary colurnn increases with its thickness. If, instead of sediment filling, the water body of
the basin is removed (e.g. by evaporation as known
from the Mediterranean during the upper Miocene)
the basin floor rises due to isostatic rebound.
These effects have to be taken into account in the
following basin models. Some types of curves for the
tectonic subsidence history of various basins are depicted in Fig. 11.10b. All these curves are modified
by sediment load-driven subsidence. Some examples
may illustrate the theoretical considerations of this
Section.
Two East African Lakes: A Comparison
The East African Rift lakes have existed for about 20
Ma (Meybeck 1995) and vary greatly with respect to